GovTech · Smart City · CTO · 2023–2025
CEGIR — A Smart-City Platform for Santiago's Metropolitan Region.
A ~$2M USD public-sector technology program for Chile's largest metropolitan government, delivered and handed over in 19 months.
Official CEGIR program video — Gobierno Regional Metropolitano de Santiago × Universidad Católica de Chile.
At a glance
~$2M
Program budget (USD), delivered
19
Months to government handover
262
Geospatial layers · 50+ institutions
100+
People across the program · 15–20 engineers
What CEGIR is.
CEGIR — Centro de Gestión Integrada Regional — is a regional-government technology program co-developed by the Gobierno Regional Metropolitano de Santiago and the Pontificia Universidad Católica de Chile, serving Chile's most populous region (7M+ residents). Its mission: unify geospatial data from dozens of public institutions, add analytics and AI on top, and make the results usable by non-technical decision-makers through a physical control room, web, and tactile interfaces.
Over 19 months, the program produced seven interoperable sub-products, a live operations room, and the governance model needed to hand everything over to the regional government as an ongoing service. More than 100 people were involved across the program; the technical core I led directly was a focused group of 15–20 engineers, architects, and data specialists.
The scope of the work.
CEGIR is not one product; it is a portfolio. The scope spanned four intersecting policy domains — security, mobility, risk management, and territorial planning — across seven sub-products: a cloud data platform, a web GIS application, CCTV video analytics, public APIs, a citizen-reports mobile app, a tactile urban-planning table, and the physical control room.
All of it under government accountability — milestone-based funding, legal and ethical review of every AI component, a fixed handover date — and designed as a Design-Thinking co-production between the regional government and the university. Success was measured not only by what shipped, but by whether a regional-government team could operate the whole stack after the program closed.
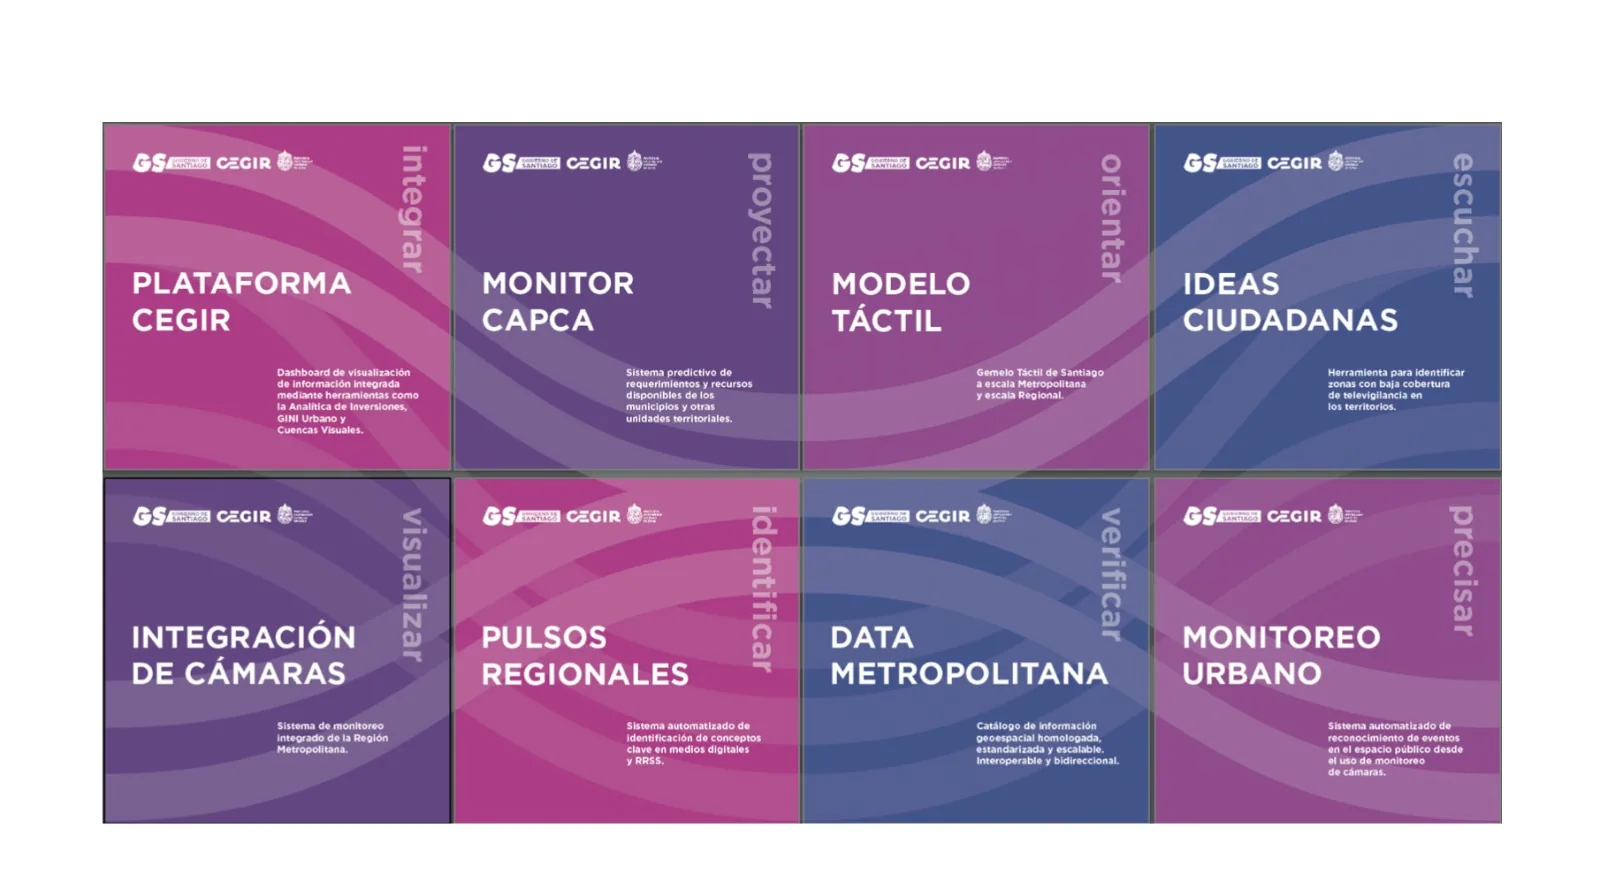
The CEGIR product catalog — each tile an interoperable sub-product of the integrated platform.
My Role
Chief Technology Officer.
Owned the program's full technology stack: architecture, product strategy, vendor selection, team structure, security and legal review, budget, and delivery. Answered to the program director and to the Gobierno Regional Metropolitano's technical counterpart.
Day-to-day, the role mixed three layers: strategic (defining where the platform was going and why), architectural (designing how the seven sub-products fit together on a multi-account AWS foundation), and hands-on (prototyping critical paths, reviewing code, and walking alongside engineers when a piece of the puzzle needed to move faster).
Key moments.
01
Choosing the cloud foundation.
A formal RFI across four cloud providers scored each on technical breadth, compliance track record, cost at year-3 scale, and geospatial/AI coverage. AWS was selected, and a multi-account architecture was stood up from day one with Organizations, Identity Center, and AWS CDK as the IaC backbone.
02
Seven products, one platform.
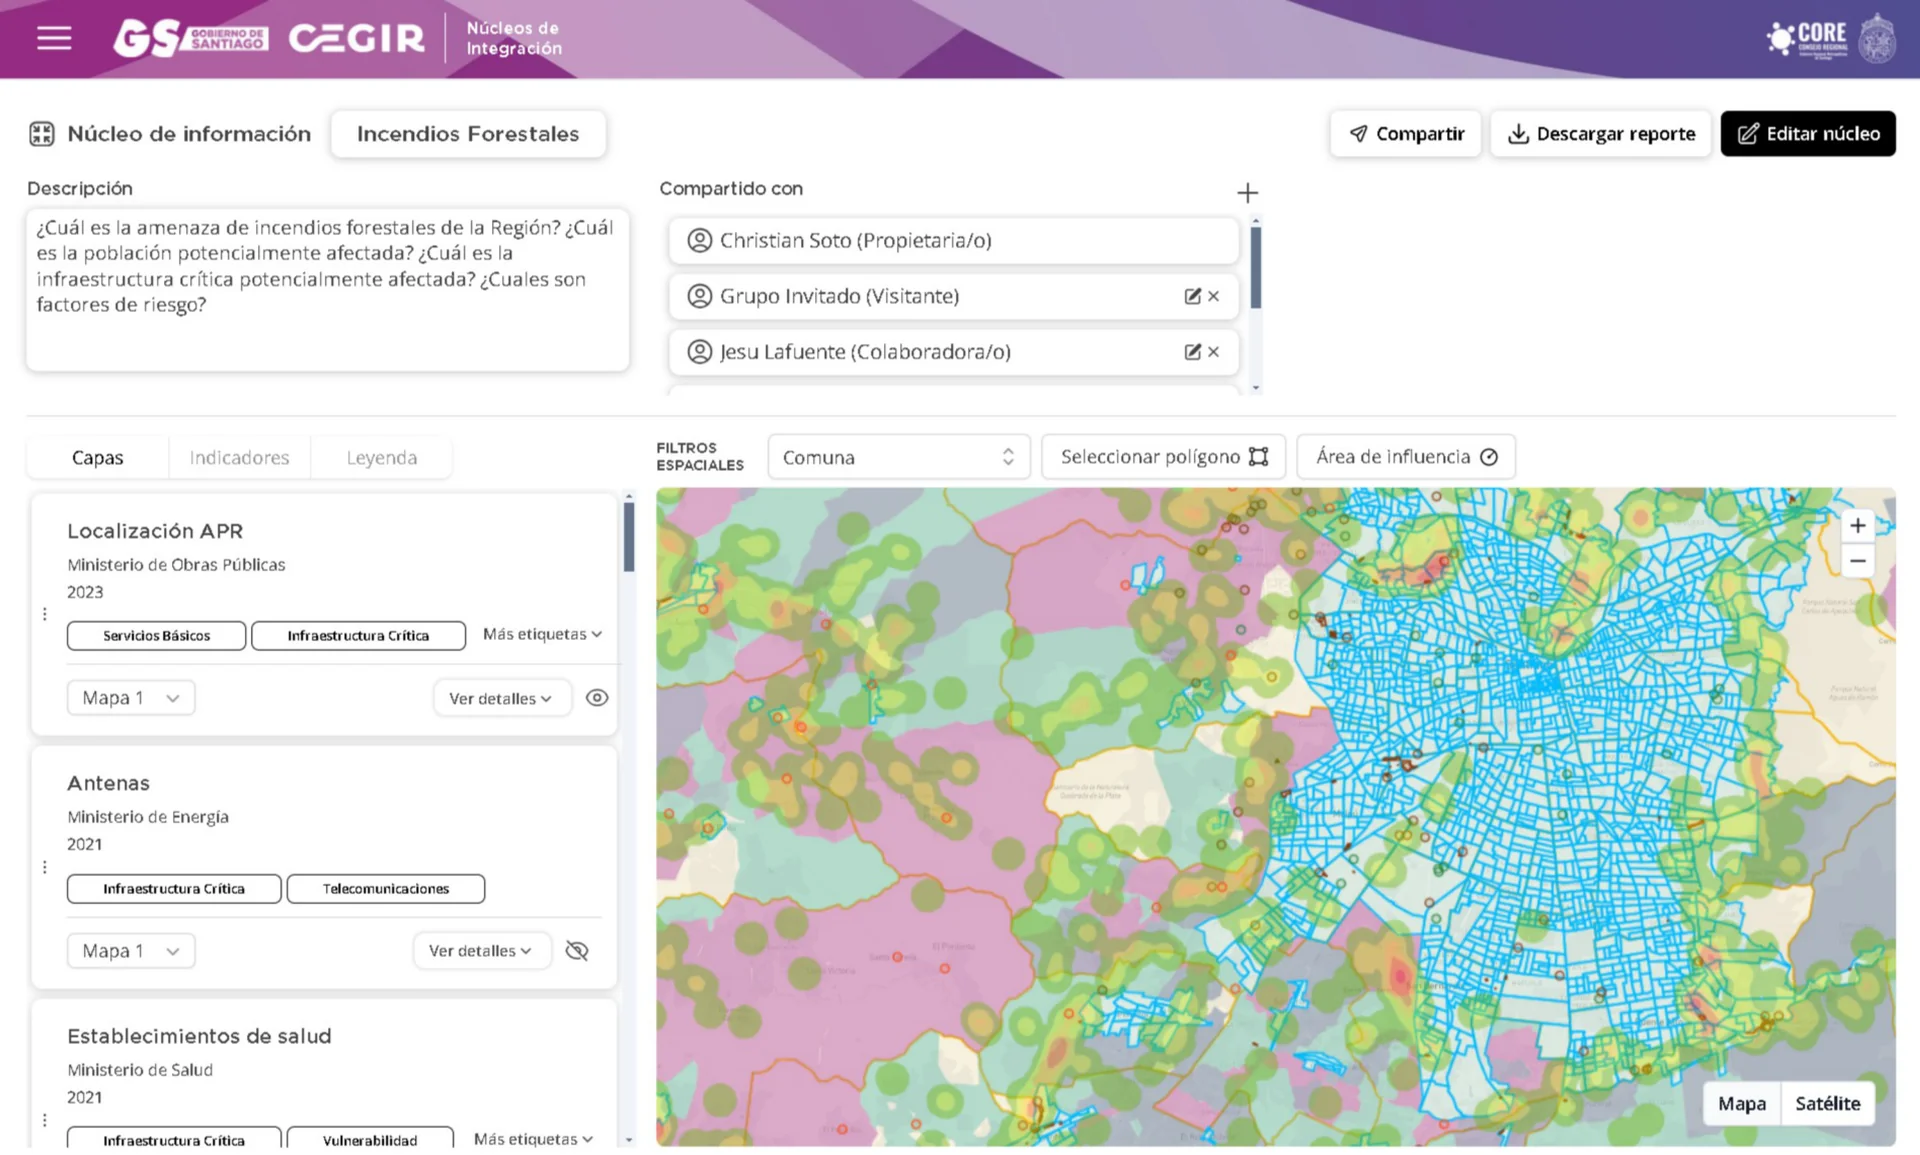
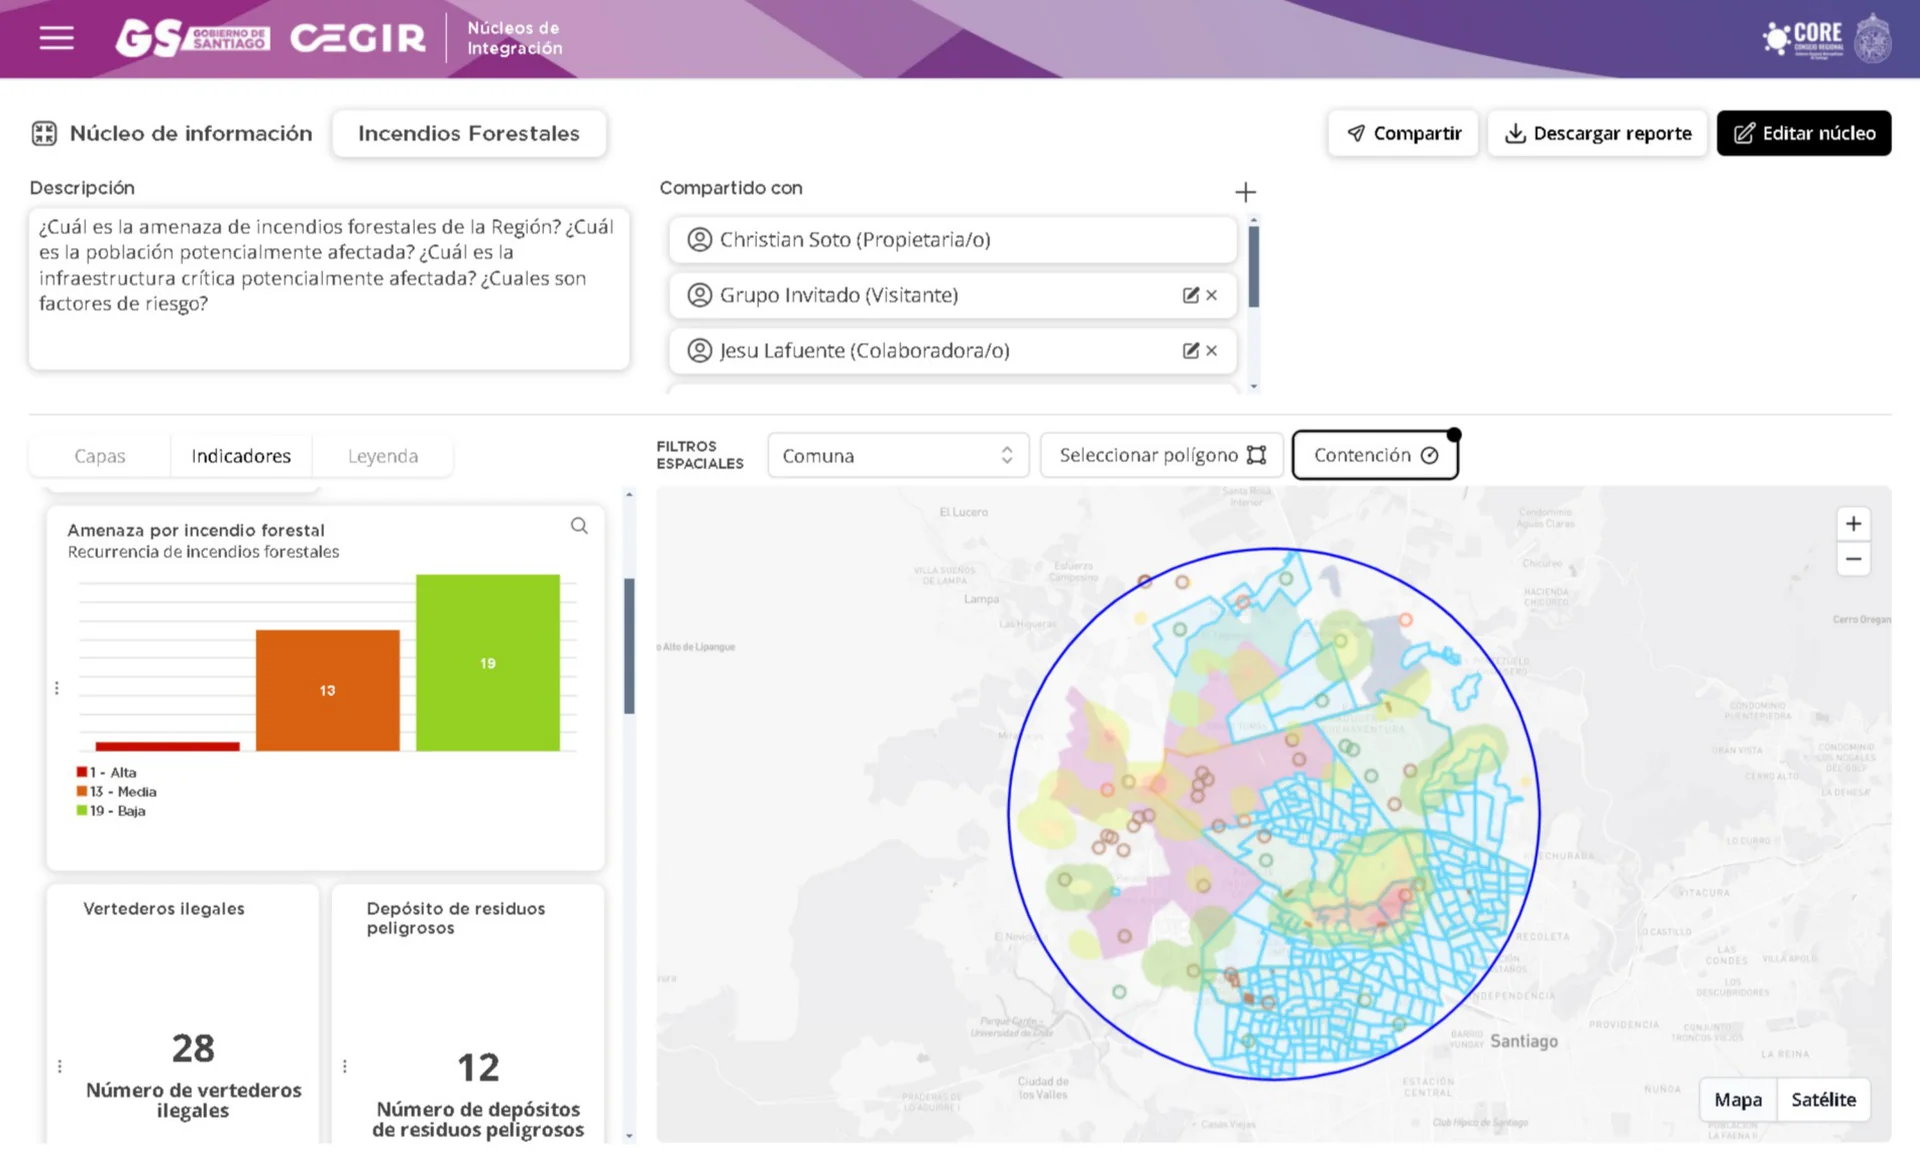
Rather than a monolith, CEGIR was decomposed into seven sub-products — each with its own user, roadmap, and success criteria — prioritized with the government counterpart using WSJF and MoSCoW. The flagship is Núcleos de Integración: a collaborative GIS environment where users assemble shareable bundles of layers, indicators, and spatial filters over the DATAMET catalog.
03
Engineering practice at scale.
With seven sub-products, multiple vendors, and a hard delivery date, the program ran on SAFe, feature-aligned roles, and a predictable planning-and-demo cadence across 19 months. Domain-Driven Design workshops with the government counterpart produced the ubiquitous language that later showed up in the data model and API contracts.
04
Prototyping before committing the team.
The two riskiest paths — the heterogeneous-source data lake and the live GIS visualization layer — were de-risked through rapid prototypes before the engineering teams scaled onto them. Schema homologation, WPS-driven widget recomputation, and concurrency limits were validated early, and the resulting architecture was what the teams inherited.
The platform in use.
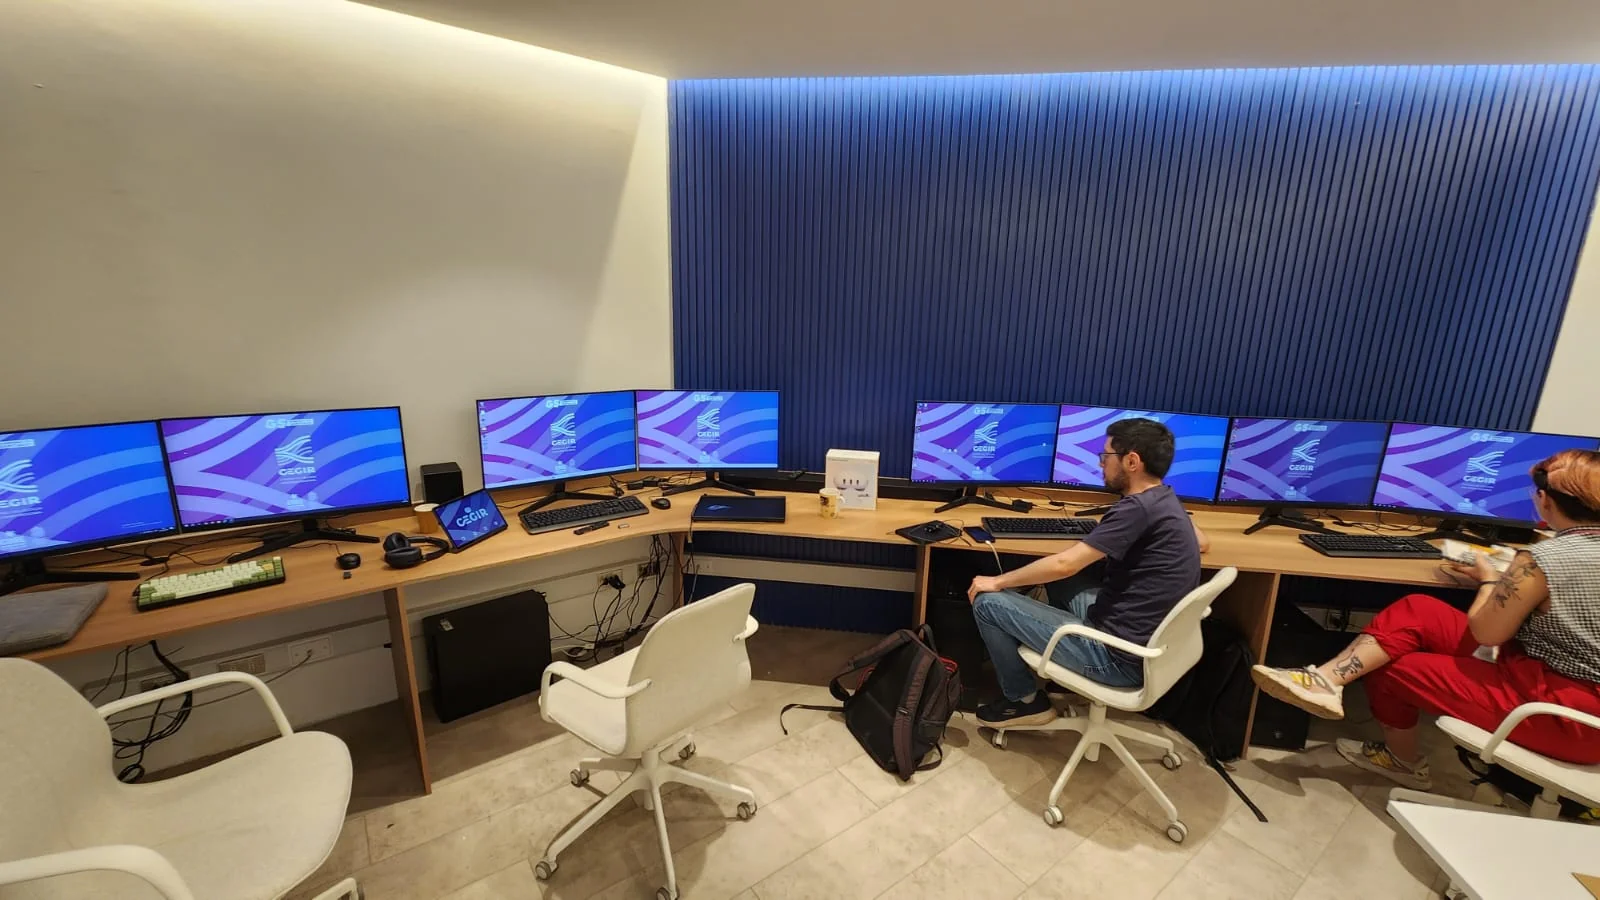
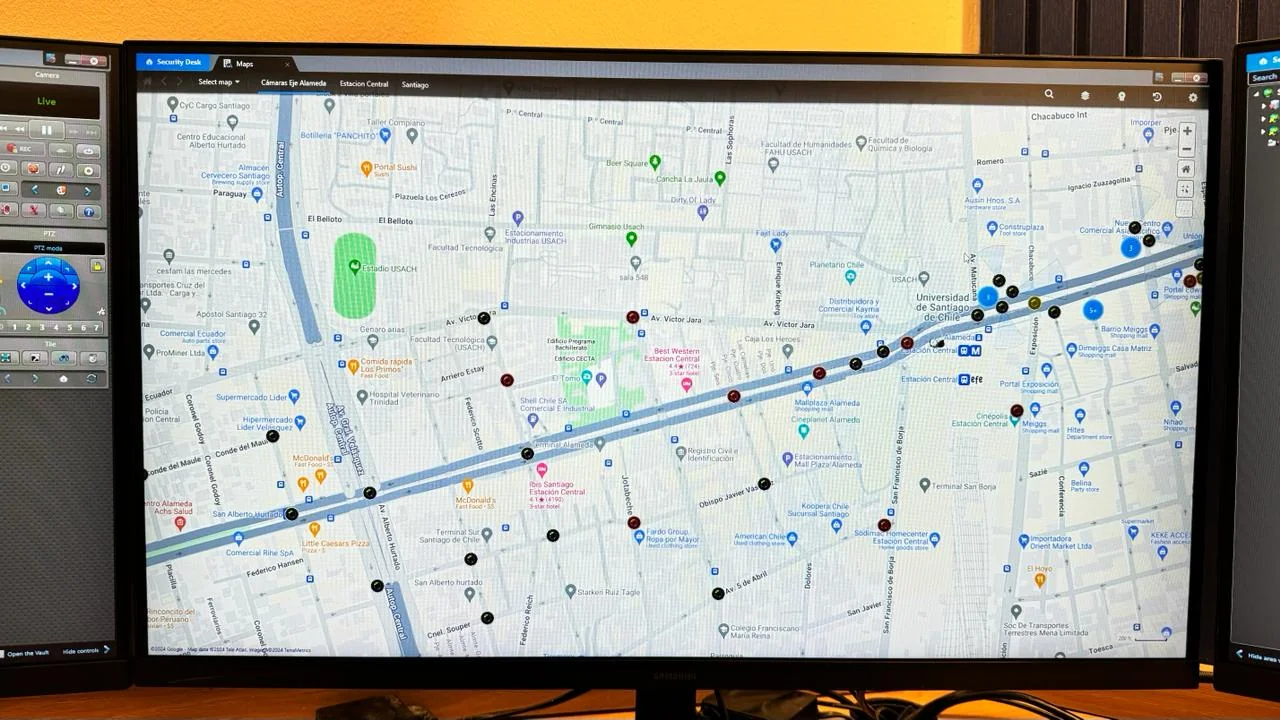
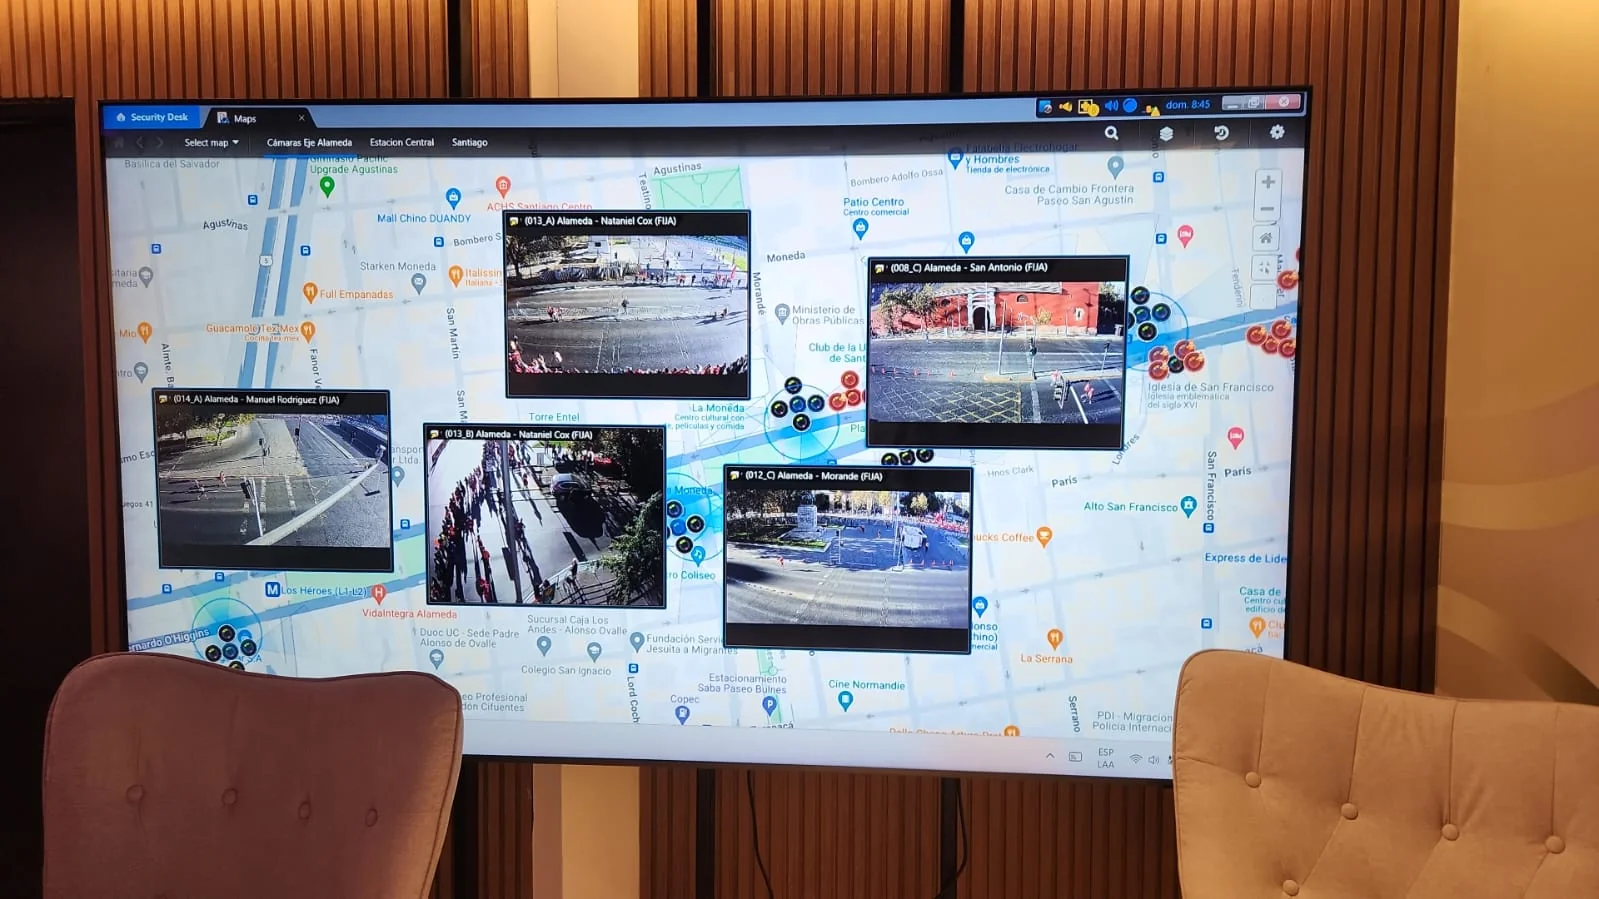
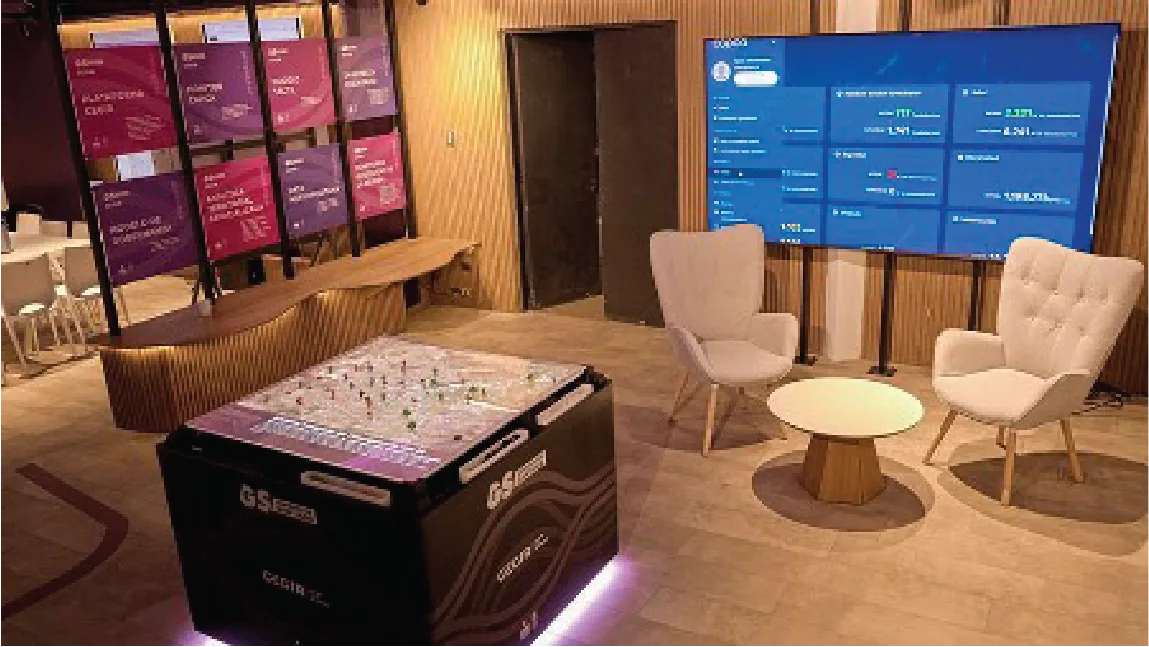
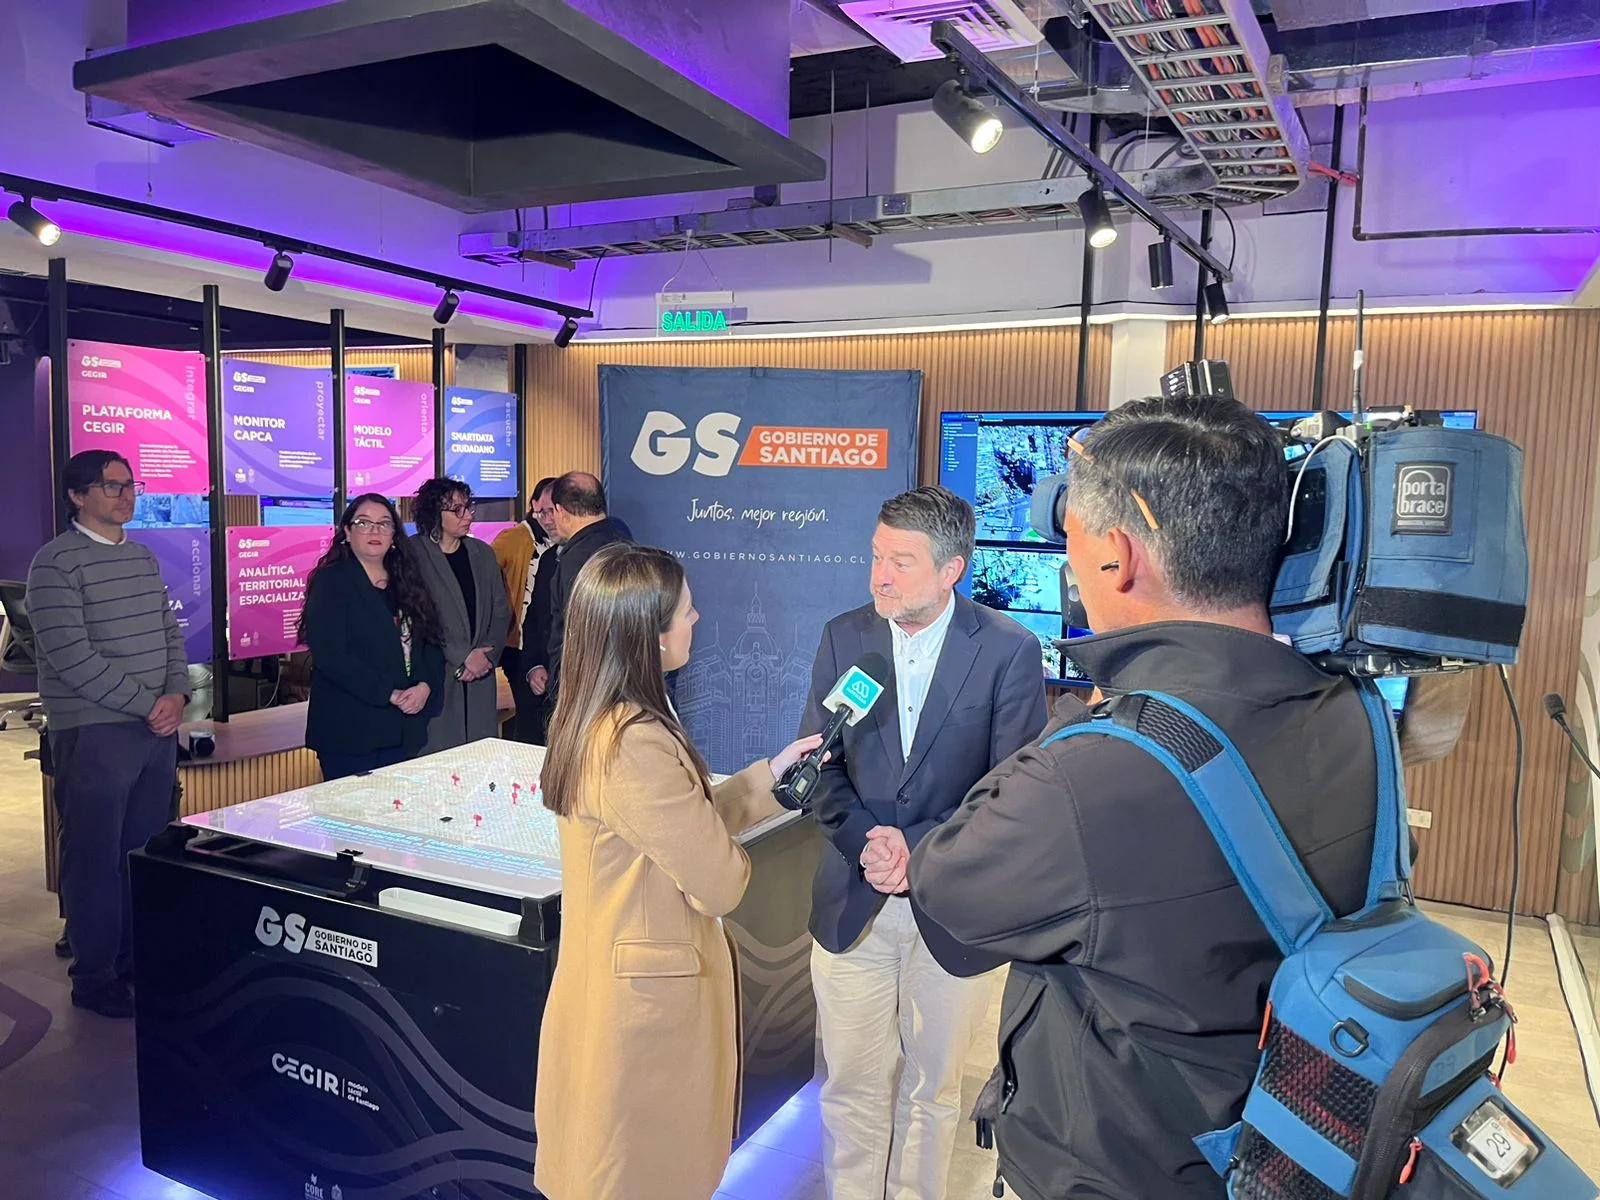
The platform was not built in the abstract. Three flagship scenarios shaped its design from the beginning — massive public events, urban-planning collaboration, and immersive territorial analysis — and the Sala CEGIR is the physical space where these products come together for operators.
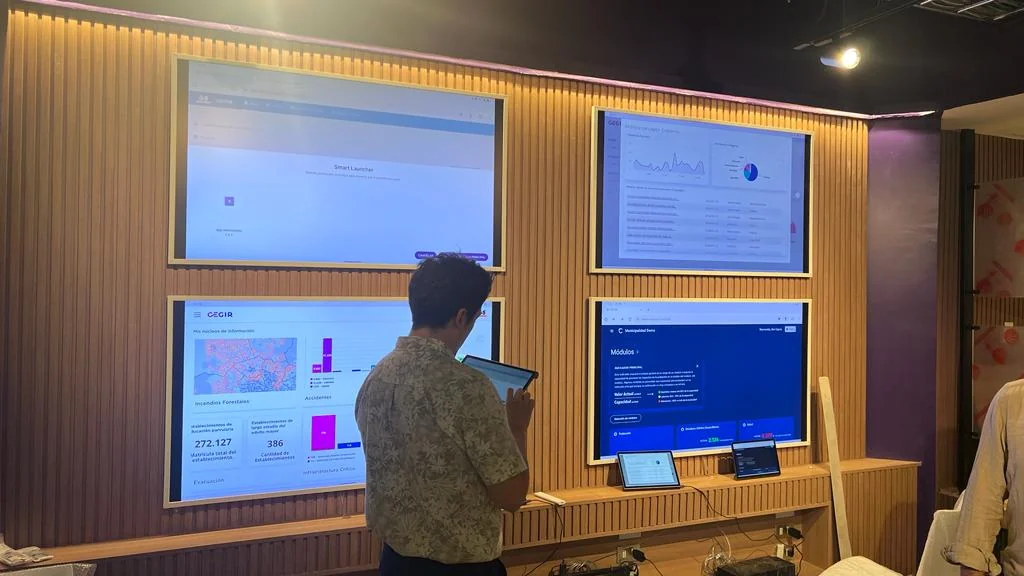
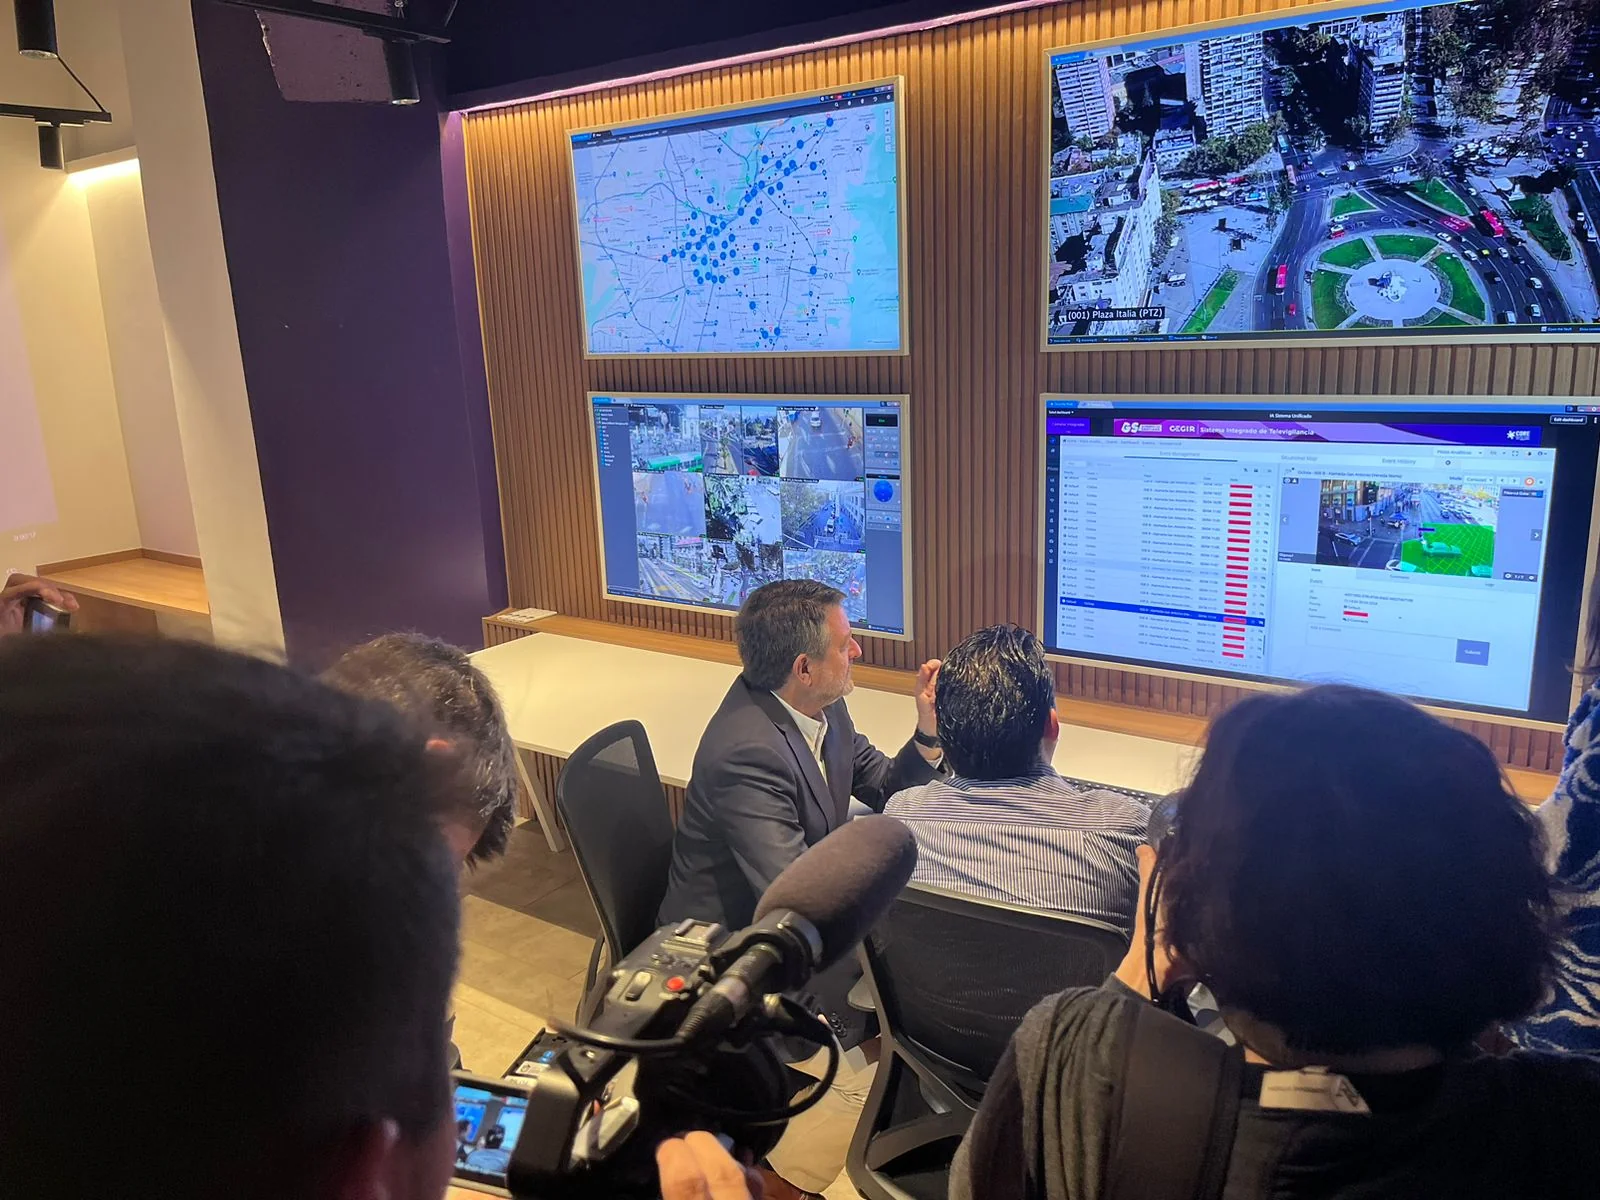
Sala CEGIR — the control room
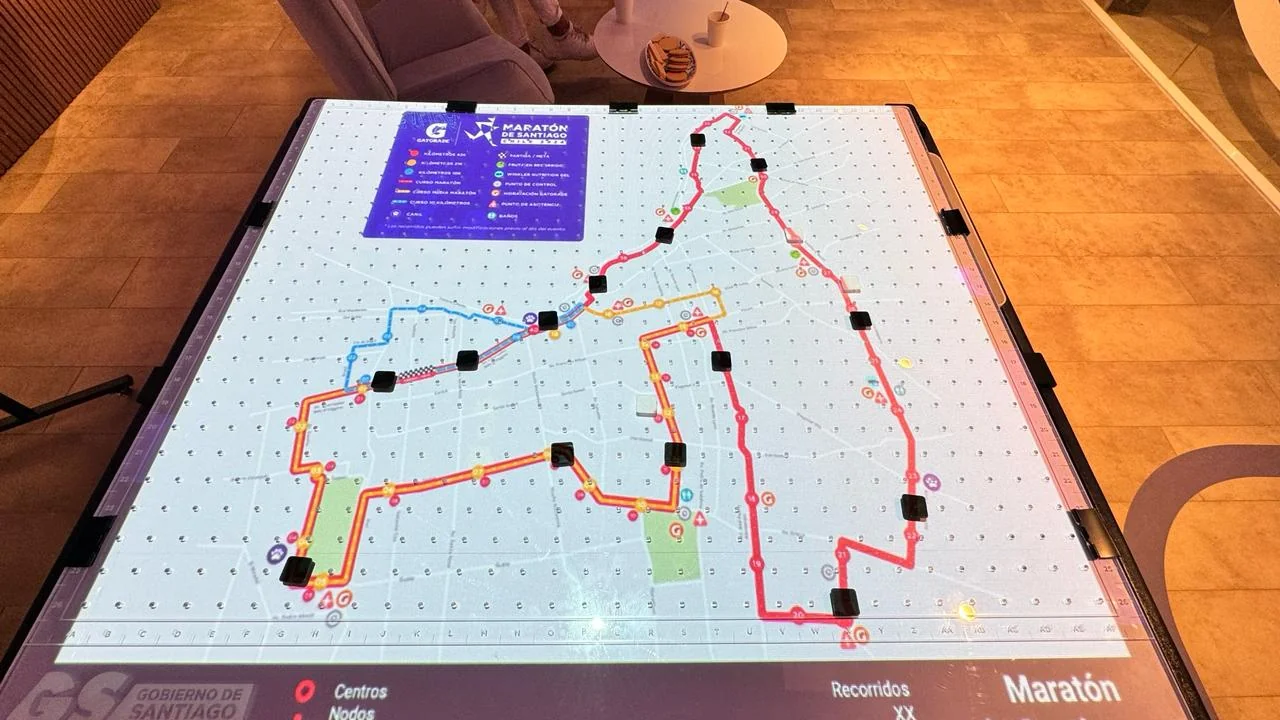
Use case · Maratón de Santiago
CEGIR was used to plan and monitor the Maratón de Santiago — a flagship massive event scenario. The tactile table visualized the 42k / 21k / 10k courses, control points, hydration and nutrition stations, medical posts, and restrooms. On race day, the web platform was used in the field for live operational monitoring.
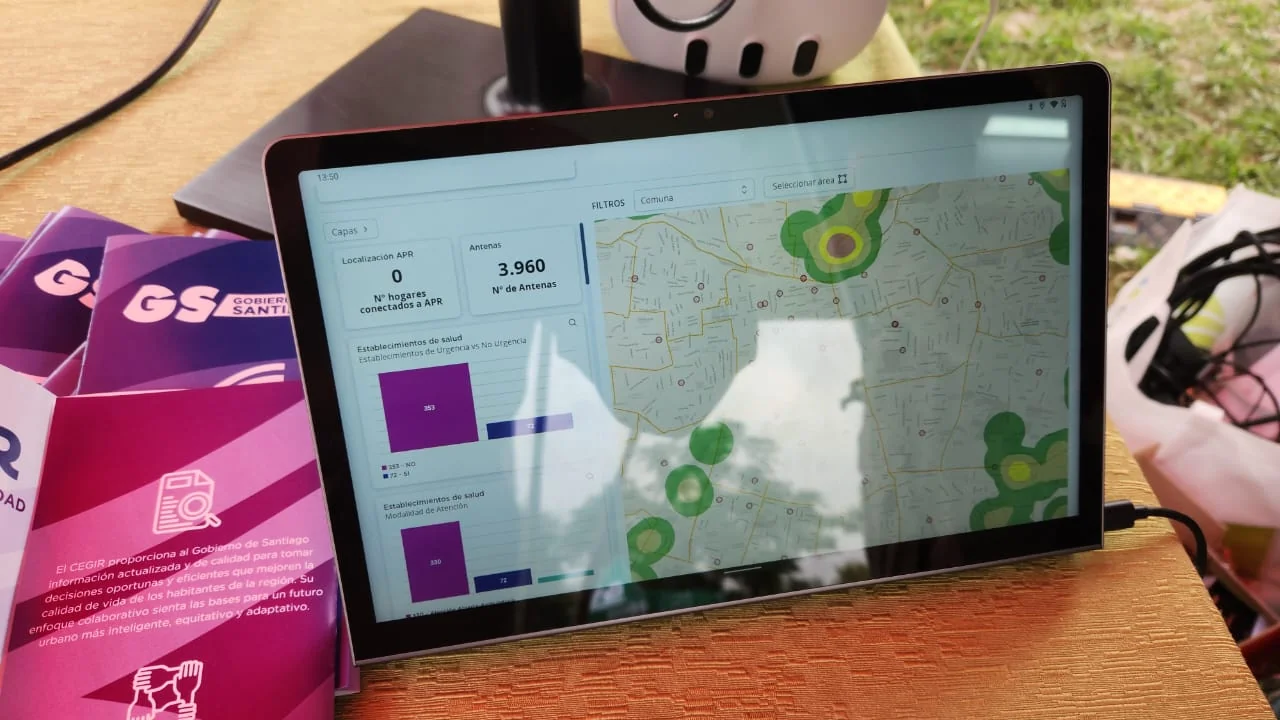

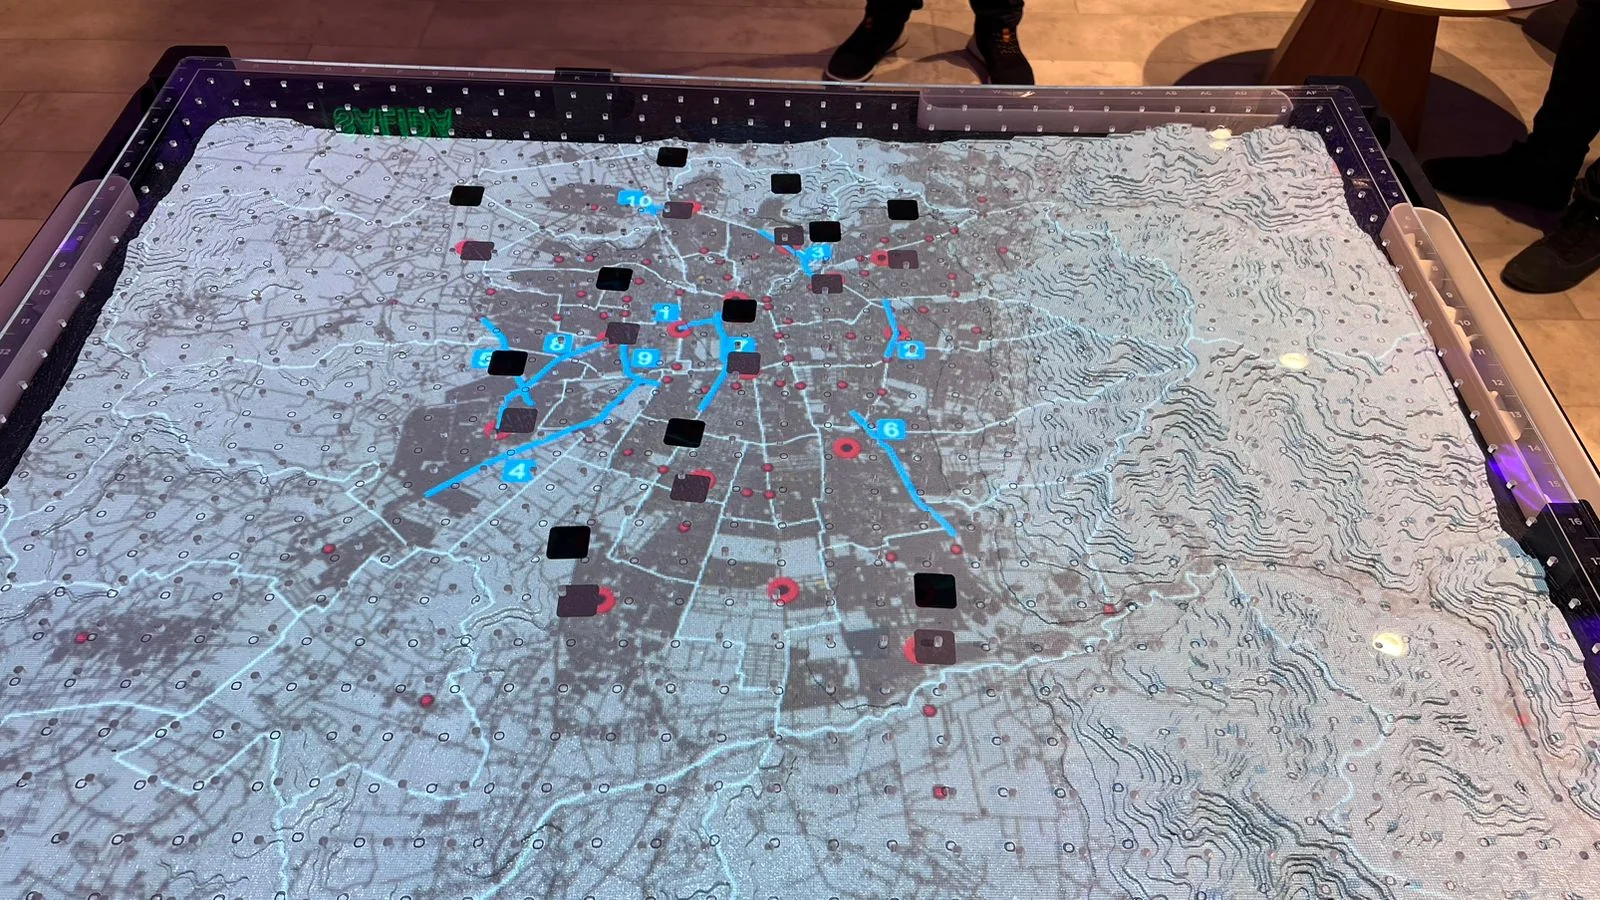
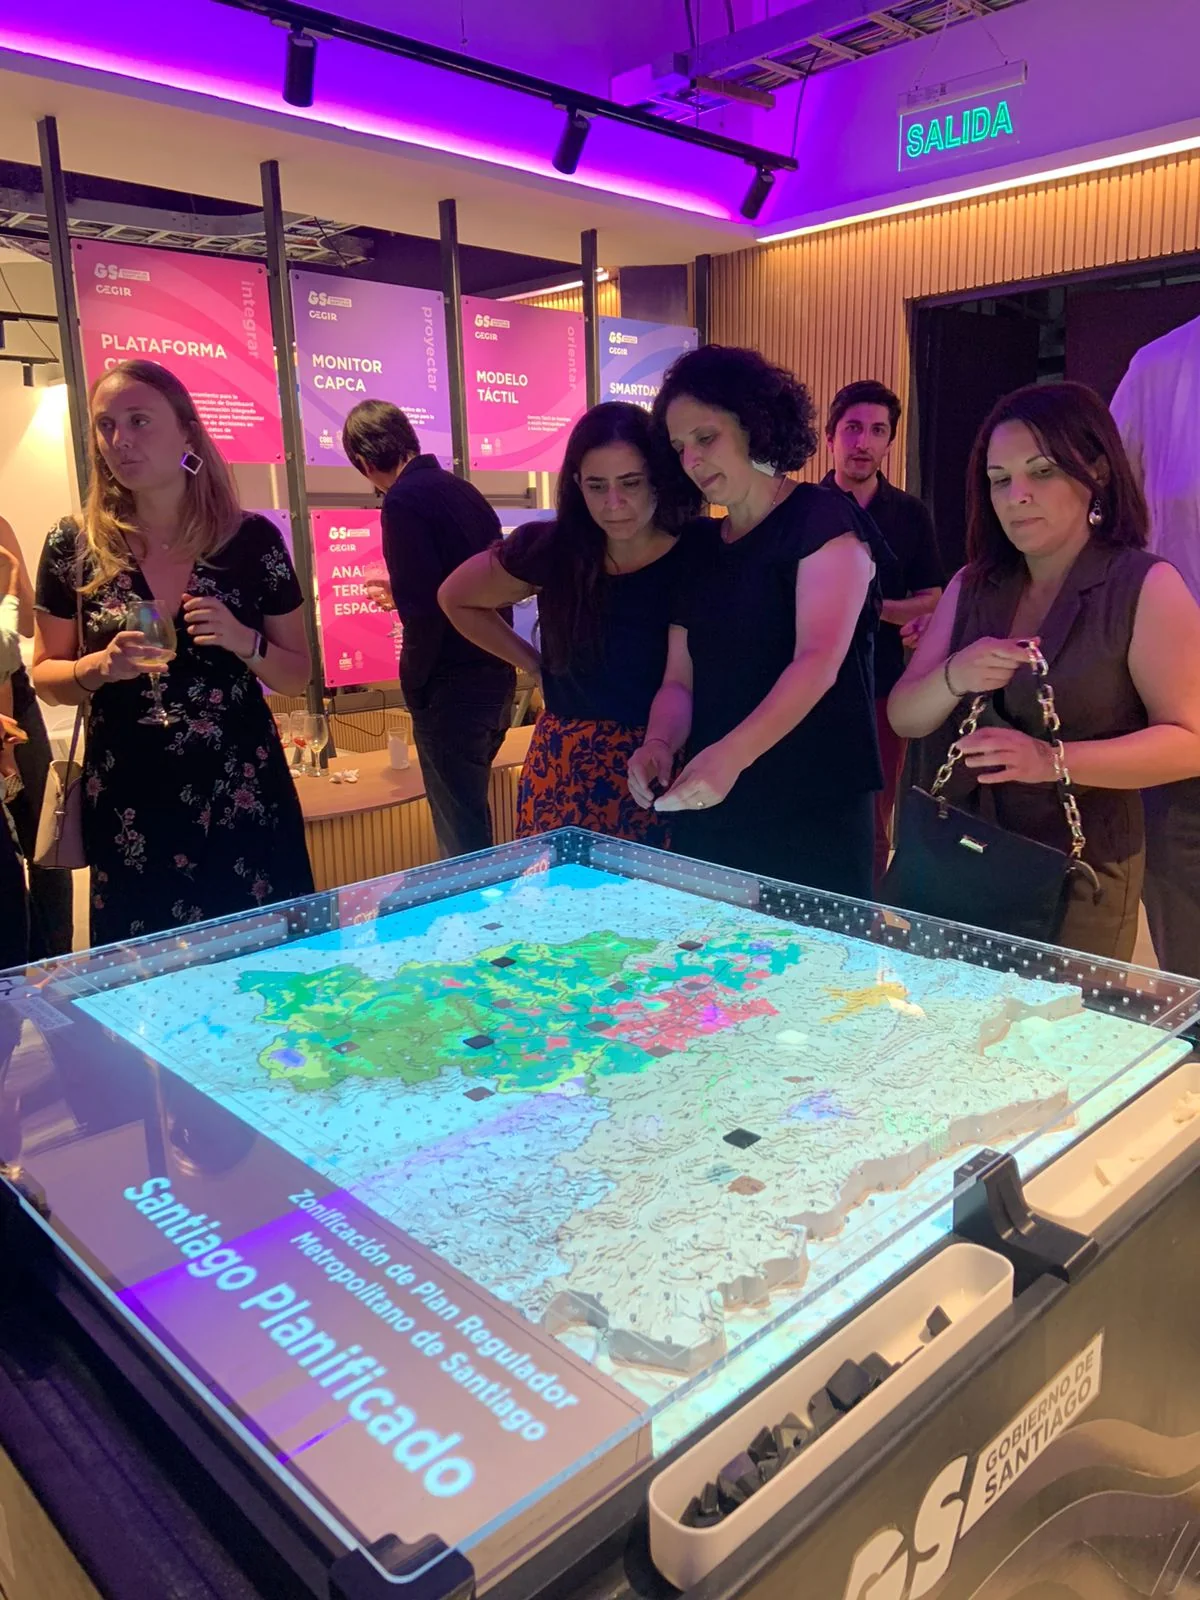
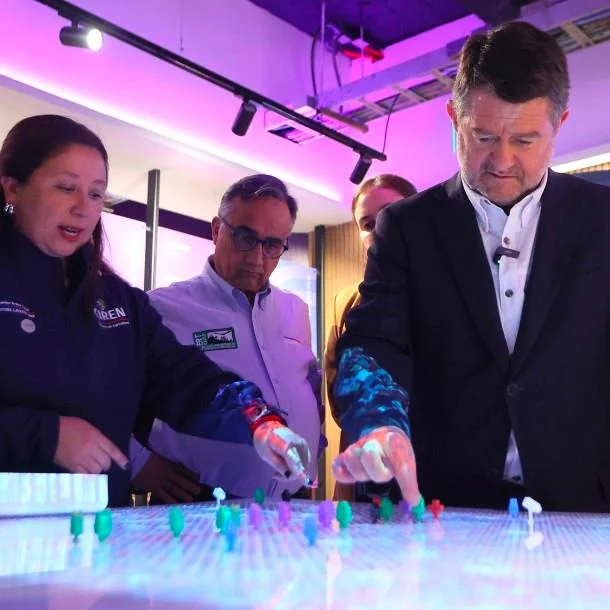
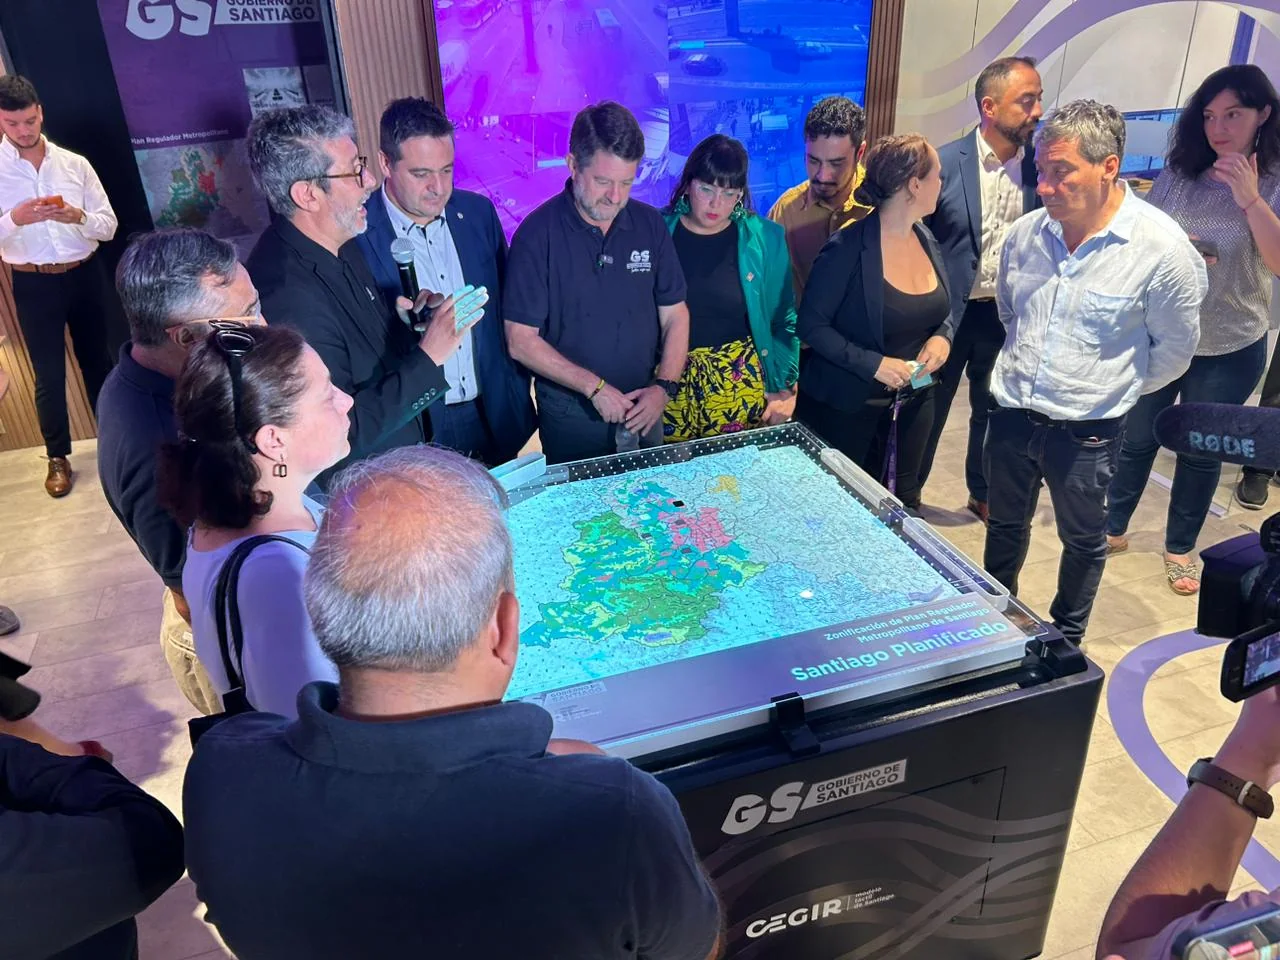
Use case · Urban planning (Modelo Táctil)
The Modelo Táctil is a tactile/projection table — a physical twin of Santiago at metropolitan and regional scale — used in workshops with planners and authorities to visualize regulatory instruments, infrastructure, and scenario overlays.
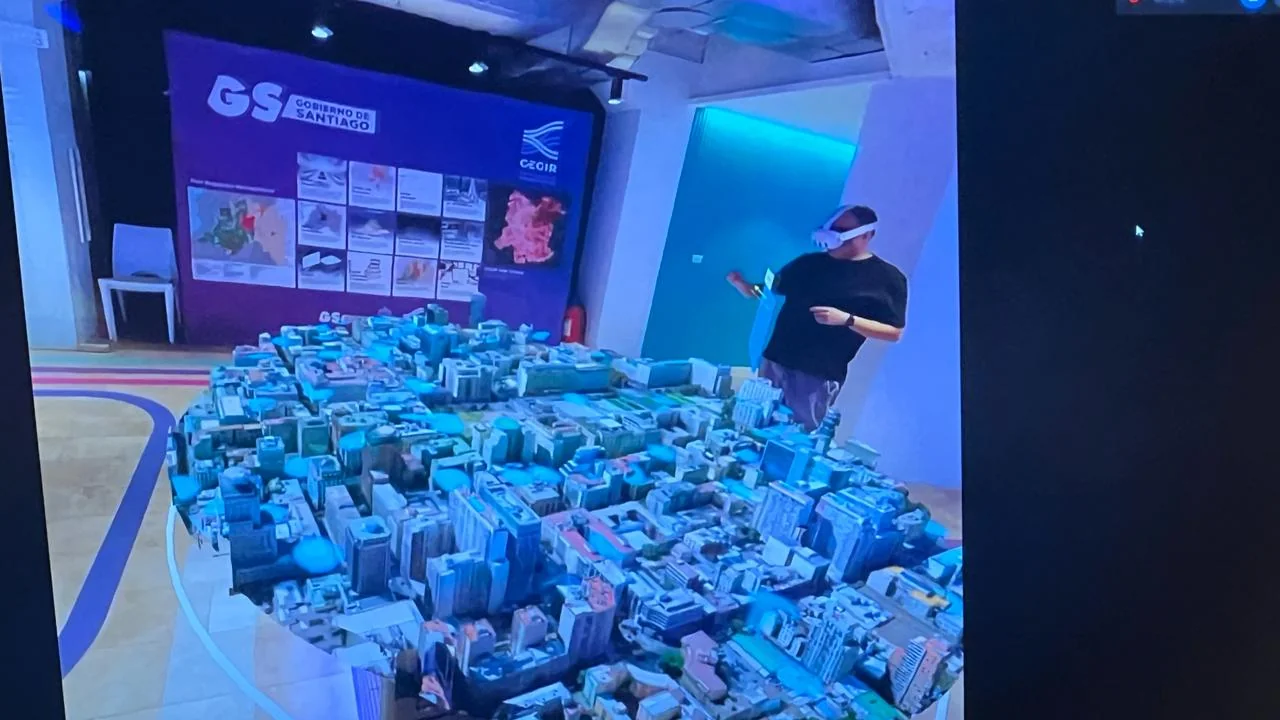
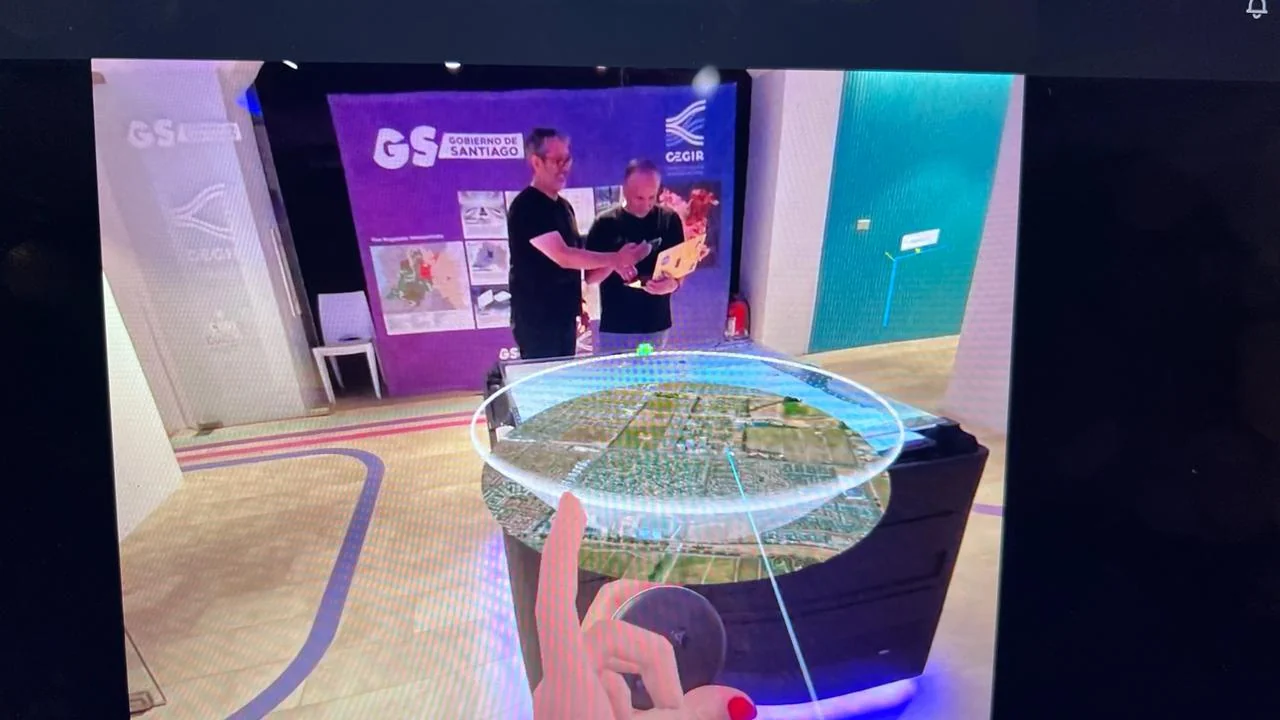
Use case · VR 3D model of Santiago
A VR experience complements the tactile table: users can "fly over" a 3D model of Santiago and inspect the territory at any scale. Built as a demo capability for workshops and public-facing events.

The outcome.
- ~$2M USD program delivered and formally handed over to the Gobierno Regional Metropolitano de Santiago.
- 262 geospatial data layers from 50+ institutions integrated into the DATAMET catalog and the CEGIR data lake.
- Architecture designed to scale from ~1,200 concurrent users in year one to ~5,600 users at year three, and from 7 TB to 40+ TB of data lake storage.
- 4 cloud providers evaluated through a formal RFI; AWS selected and deployed across 40+ services as a multi-account, IaC-managed foundation.
- 7 sub-products shipped under a shared governance and technical model — from the data lake and GIS platform to CCTV analytics, the public SmartData API, the citizen-reports app, the tactile model, and the Sala CEGIR.
- AI components (computer vision on public-space cameras; LLM features) delivered with a documented legal and ethical review under Chilean privacy law.
- Full operational handover package: architecture documentation, infrastructure-as-code, runbooks, and training so the regional government's own team could continue operating the platform after the program closed.
"An integrated, dynamic system that articulates and coordinates the actions of the region's key actors, to accelerate evidence-based decision-making in security, mobility, risk management, and territorial planning."
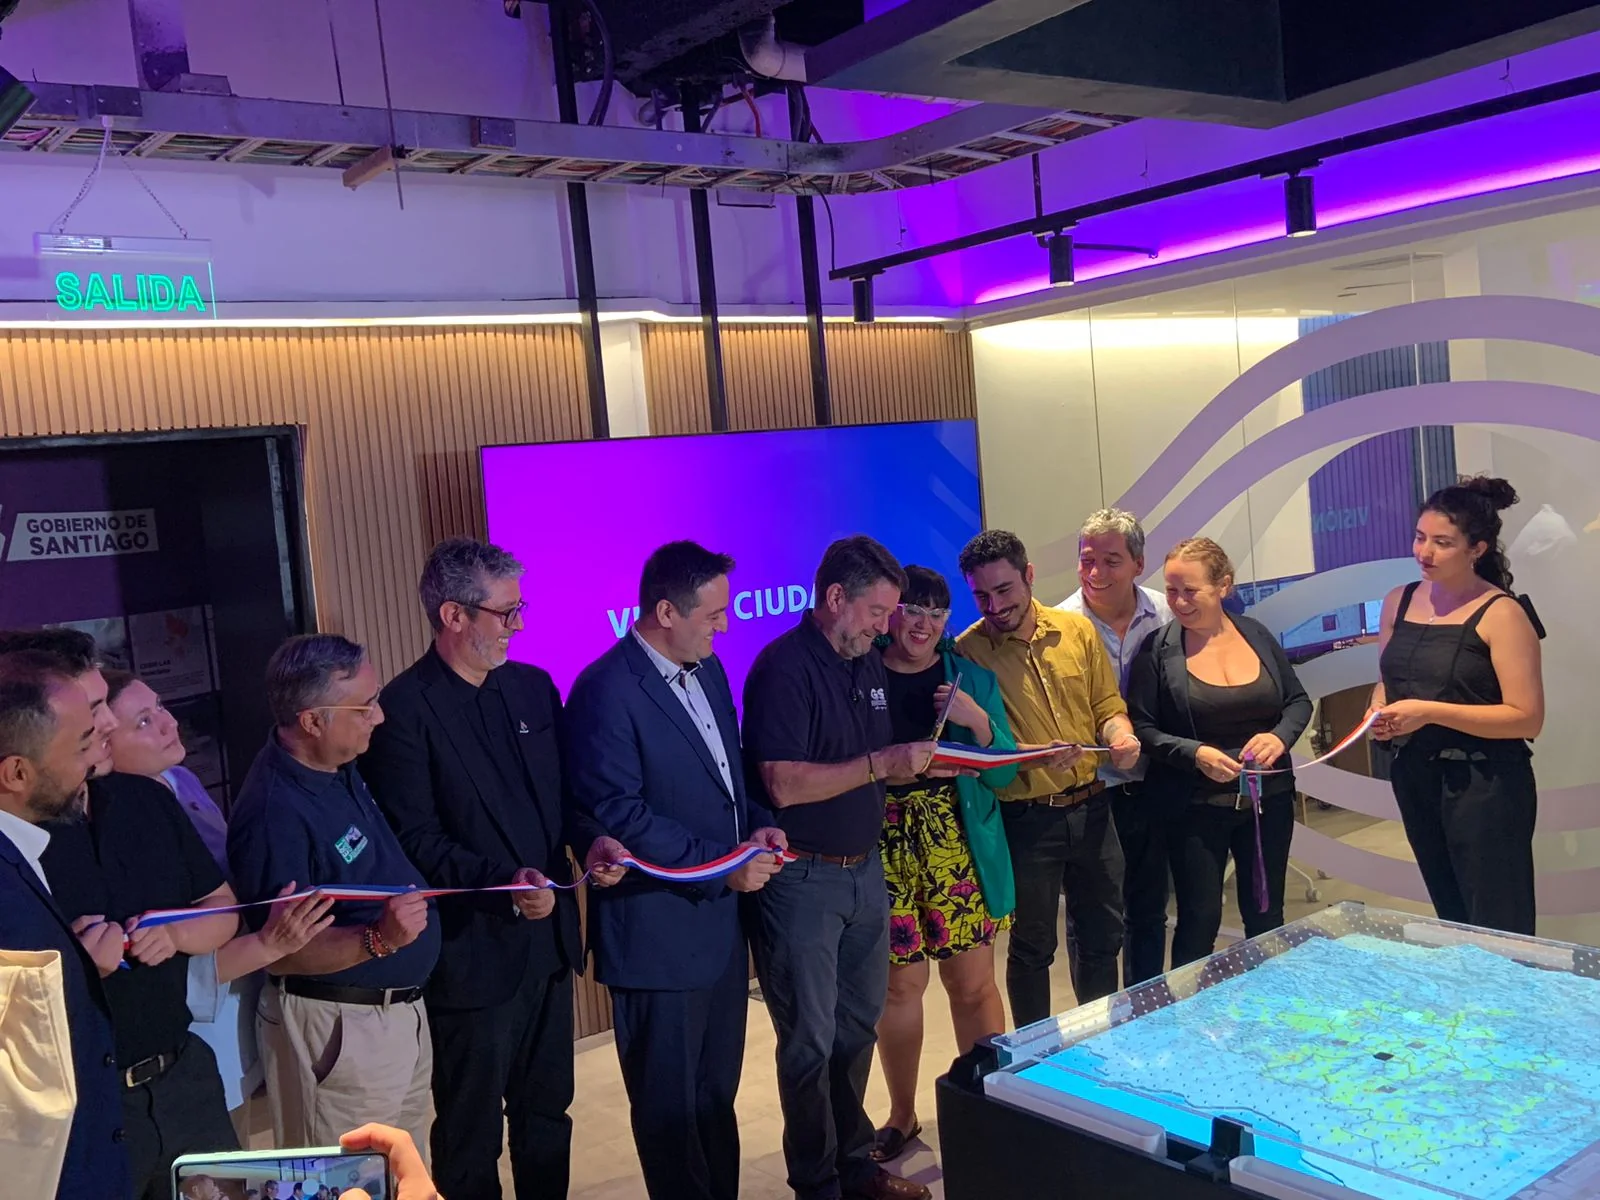
Press & inauguration.
The Sala CEGIR was inaugurated with the participation of the Governor of Santiago's Metropolitan Region and teams from the Gobierno Regional Metropolitano and Universidad Católica de Chile. The program was covered in Chilean media as one of the region's most visible public-sector technology initiatives.
In the press
Gobierno de Santiago
Con tecnología geoespacial única en el mundo: Gobierno de Santiago lanza primera imagen en alta resolución de la RM para prevenir emergencias
April 2024
La Tercera Sábado
Columna de Rodrigo Guendelman: Los dolores de la ciudad se enfrentan con el CEGIR
February 2024
Instituto de Estudios Urbanos UC
Académico Roberto Moris participó de la inauguración del Centro de Gestión Integrada Regional de Santiago
January 2024
MINVU · Centro de Estudios
Equipo de Análisis Territorial del CECT visita Centro de Gestión Integrada Regional de análisis de datos
2024
Observatorio de Ciudades UC
Data Metropolitana — CEGIR portfolio feature
2023
Cero Labs UC
GIRA — Gestión Integrada Regional y Municipal
2025
More work.
AI / SaaS · 2025
CandidatePilot
Multi-agent AI that evaluates 400 CVs so hiring teams can focus on the top 5.
AI / SaaS · 2026
AskMyCourse
A production RAG system that runs at under $1/month with verified citations.
IoT / Hardware · 2017–2018
Wenu Work
Reduced IoT measurement error from 30% to 0.25%. Device still running 9 years later.