GovTech · Municipal Management · Technical Lead · Backend · Architect
CAPCA — Predicting the limits of a municipality.
A predictive platform that tells a Chilean municipality how many months remain before its basic services hit capacity — built with Universidad Católica de Chile, live in 11+ communes today.
CAPCA — official presentation, Universidad Católica de Chile.
At a glance
10
Core municipal services monitored per commune
11+
Chilean municipalities in production today
5 yrs
Projection horizon per indicator
What CAPCA is.
CAPCA — short for Capacidad de Carga ("carrying capacity") — is a predictive software platform that helps Chilean municipalities anticipate the impacts of population change and infrastructure demand on the basic services they are responsible for delivering. Diario Sustentable described the system as "a semaphore that warns how much time remains before systems could collapse" — the platform forecasts five years ahead across ten core services and tells local decision-makers, in plain traffic-light terms, which ones they need to act on now.
CAPCA was developed at Pontificia Universidad Católica de Chile by an interdisciplinary team from the Instituto de Estudios Urbanos y Territoriales (FADEU) and the Facultad de Agronomía y Forestal, led by Prof. Roberto Moris. It grew out of the demographic-load study for Easter Island (Rapa Nui) that underpinned Chile's Law 21.070 on residency, and was funded by ANID through FONDEF-IT. Today the project is part of the HUBTEC tech-transfer portfolio and the Cero Labs UC initiative.
The scope of the work.
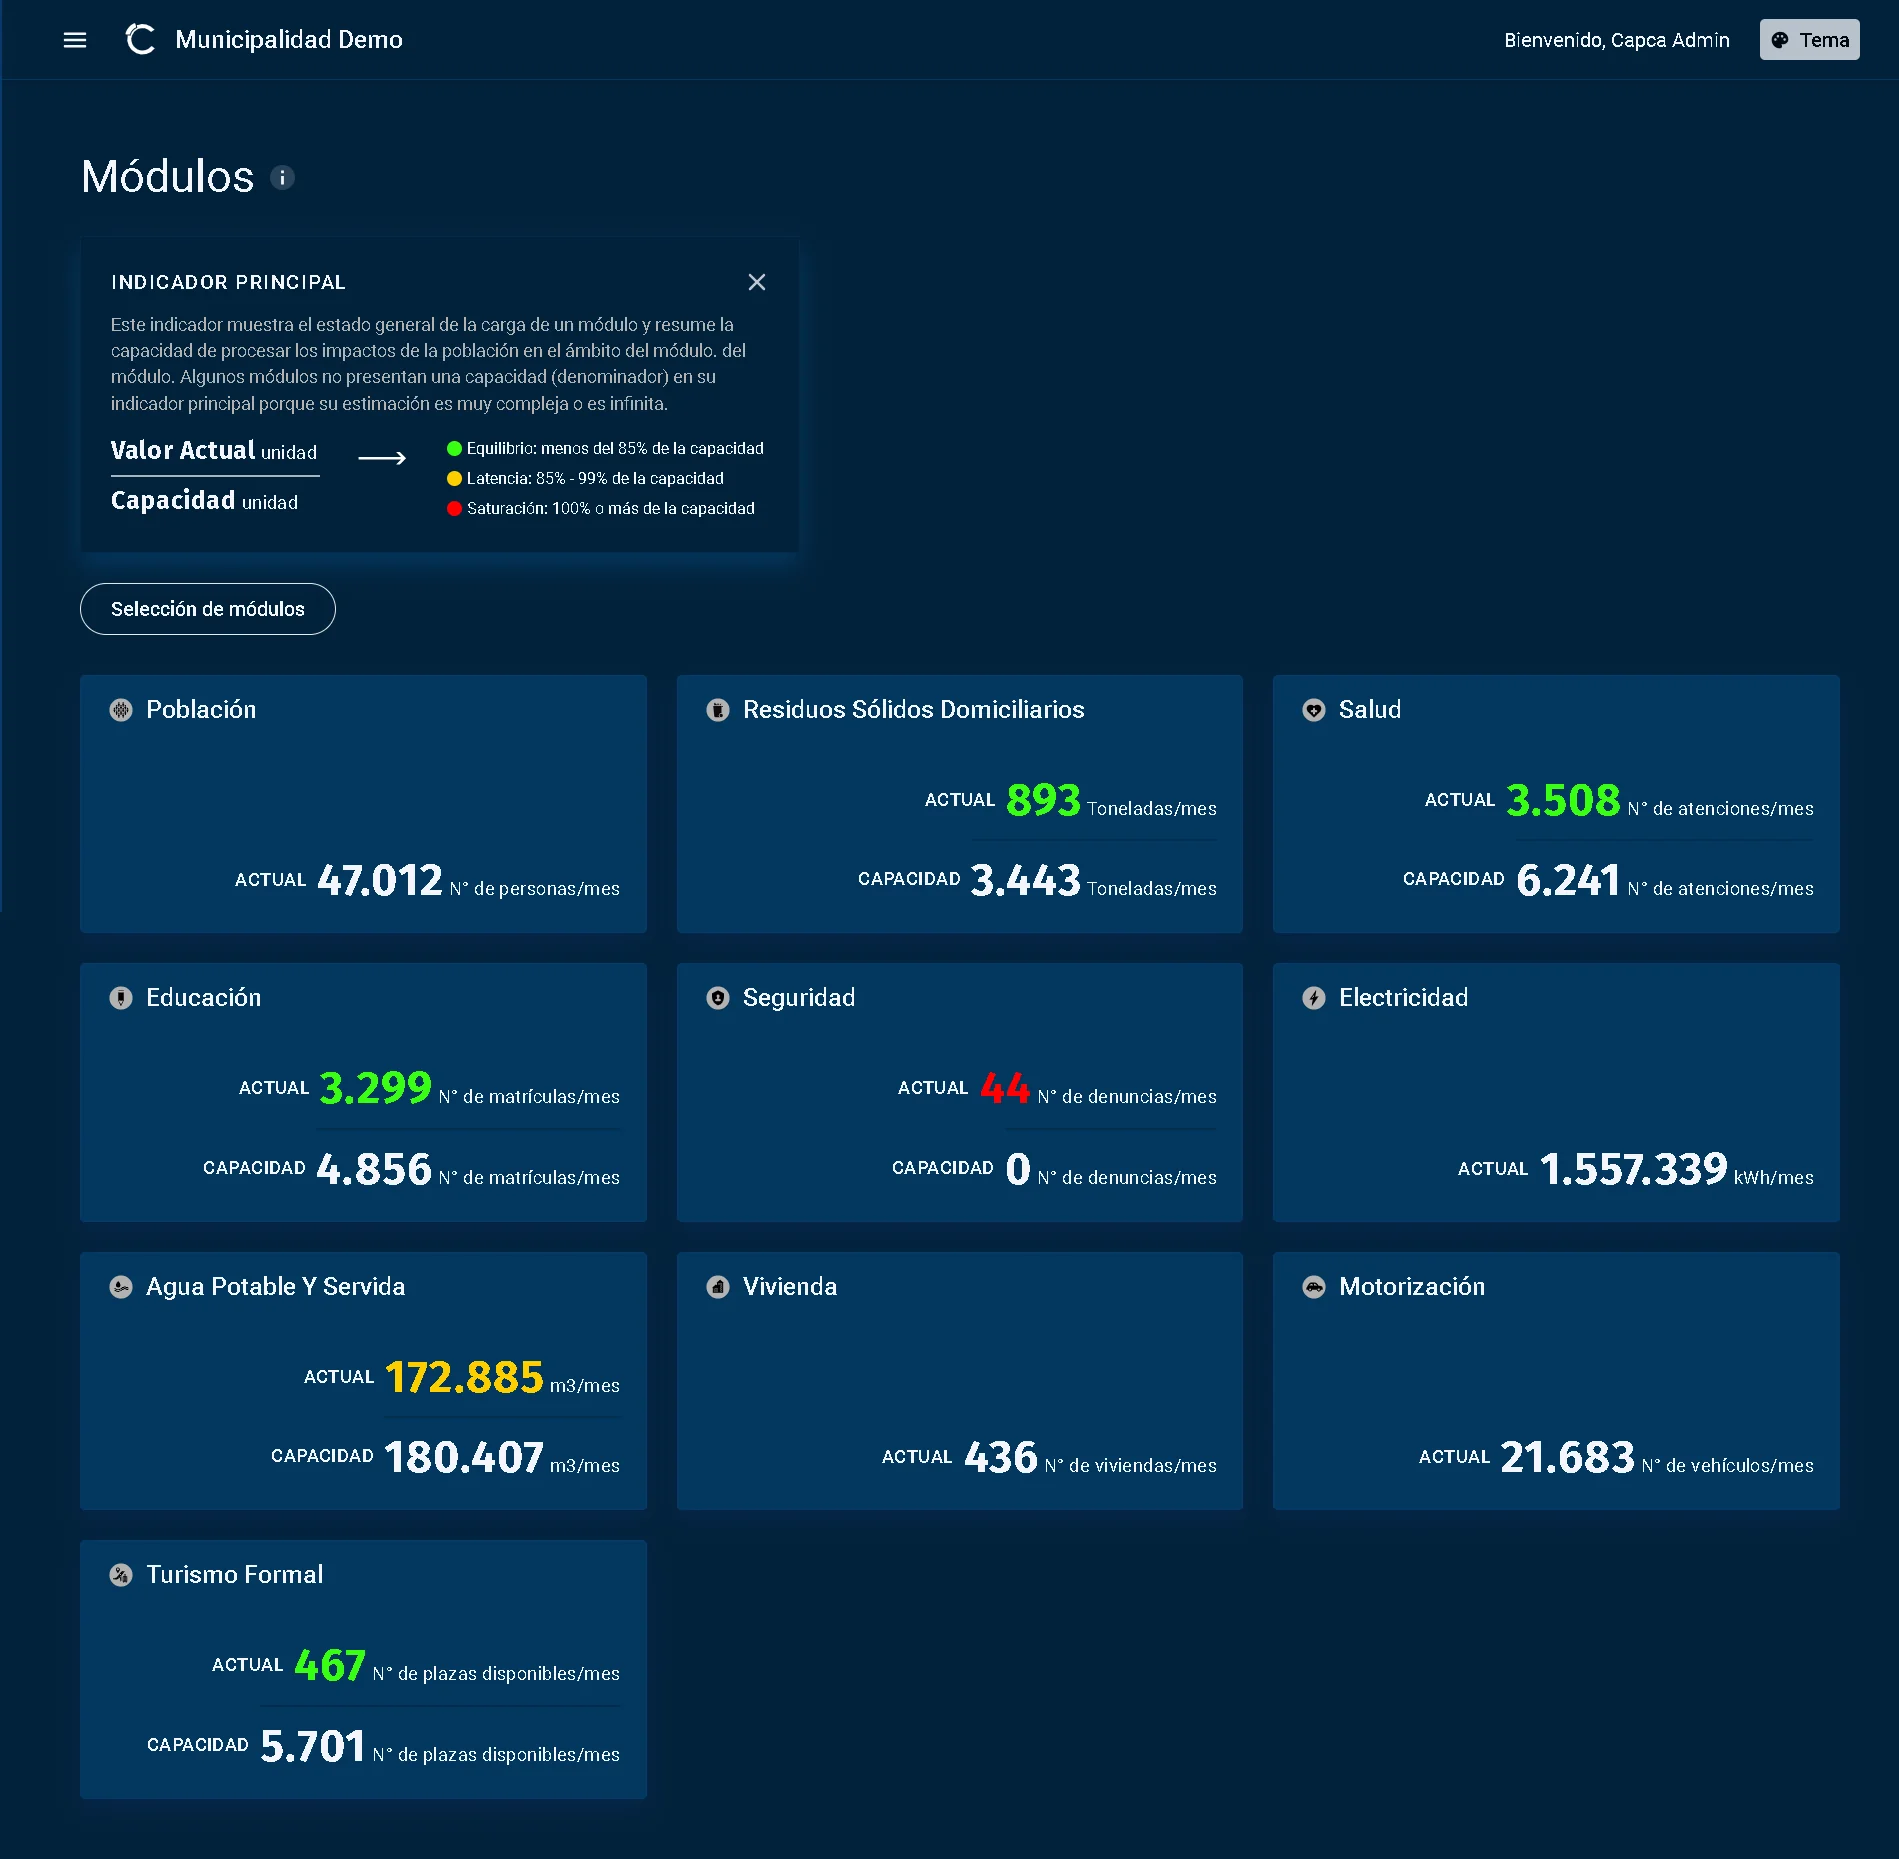
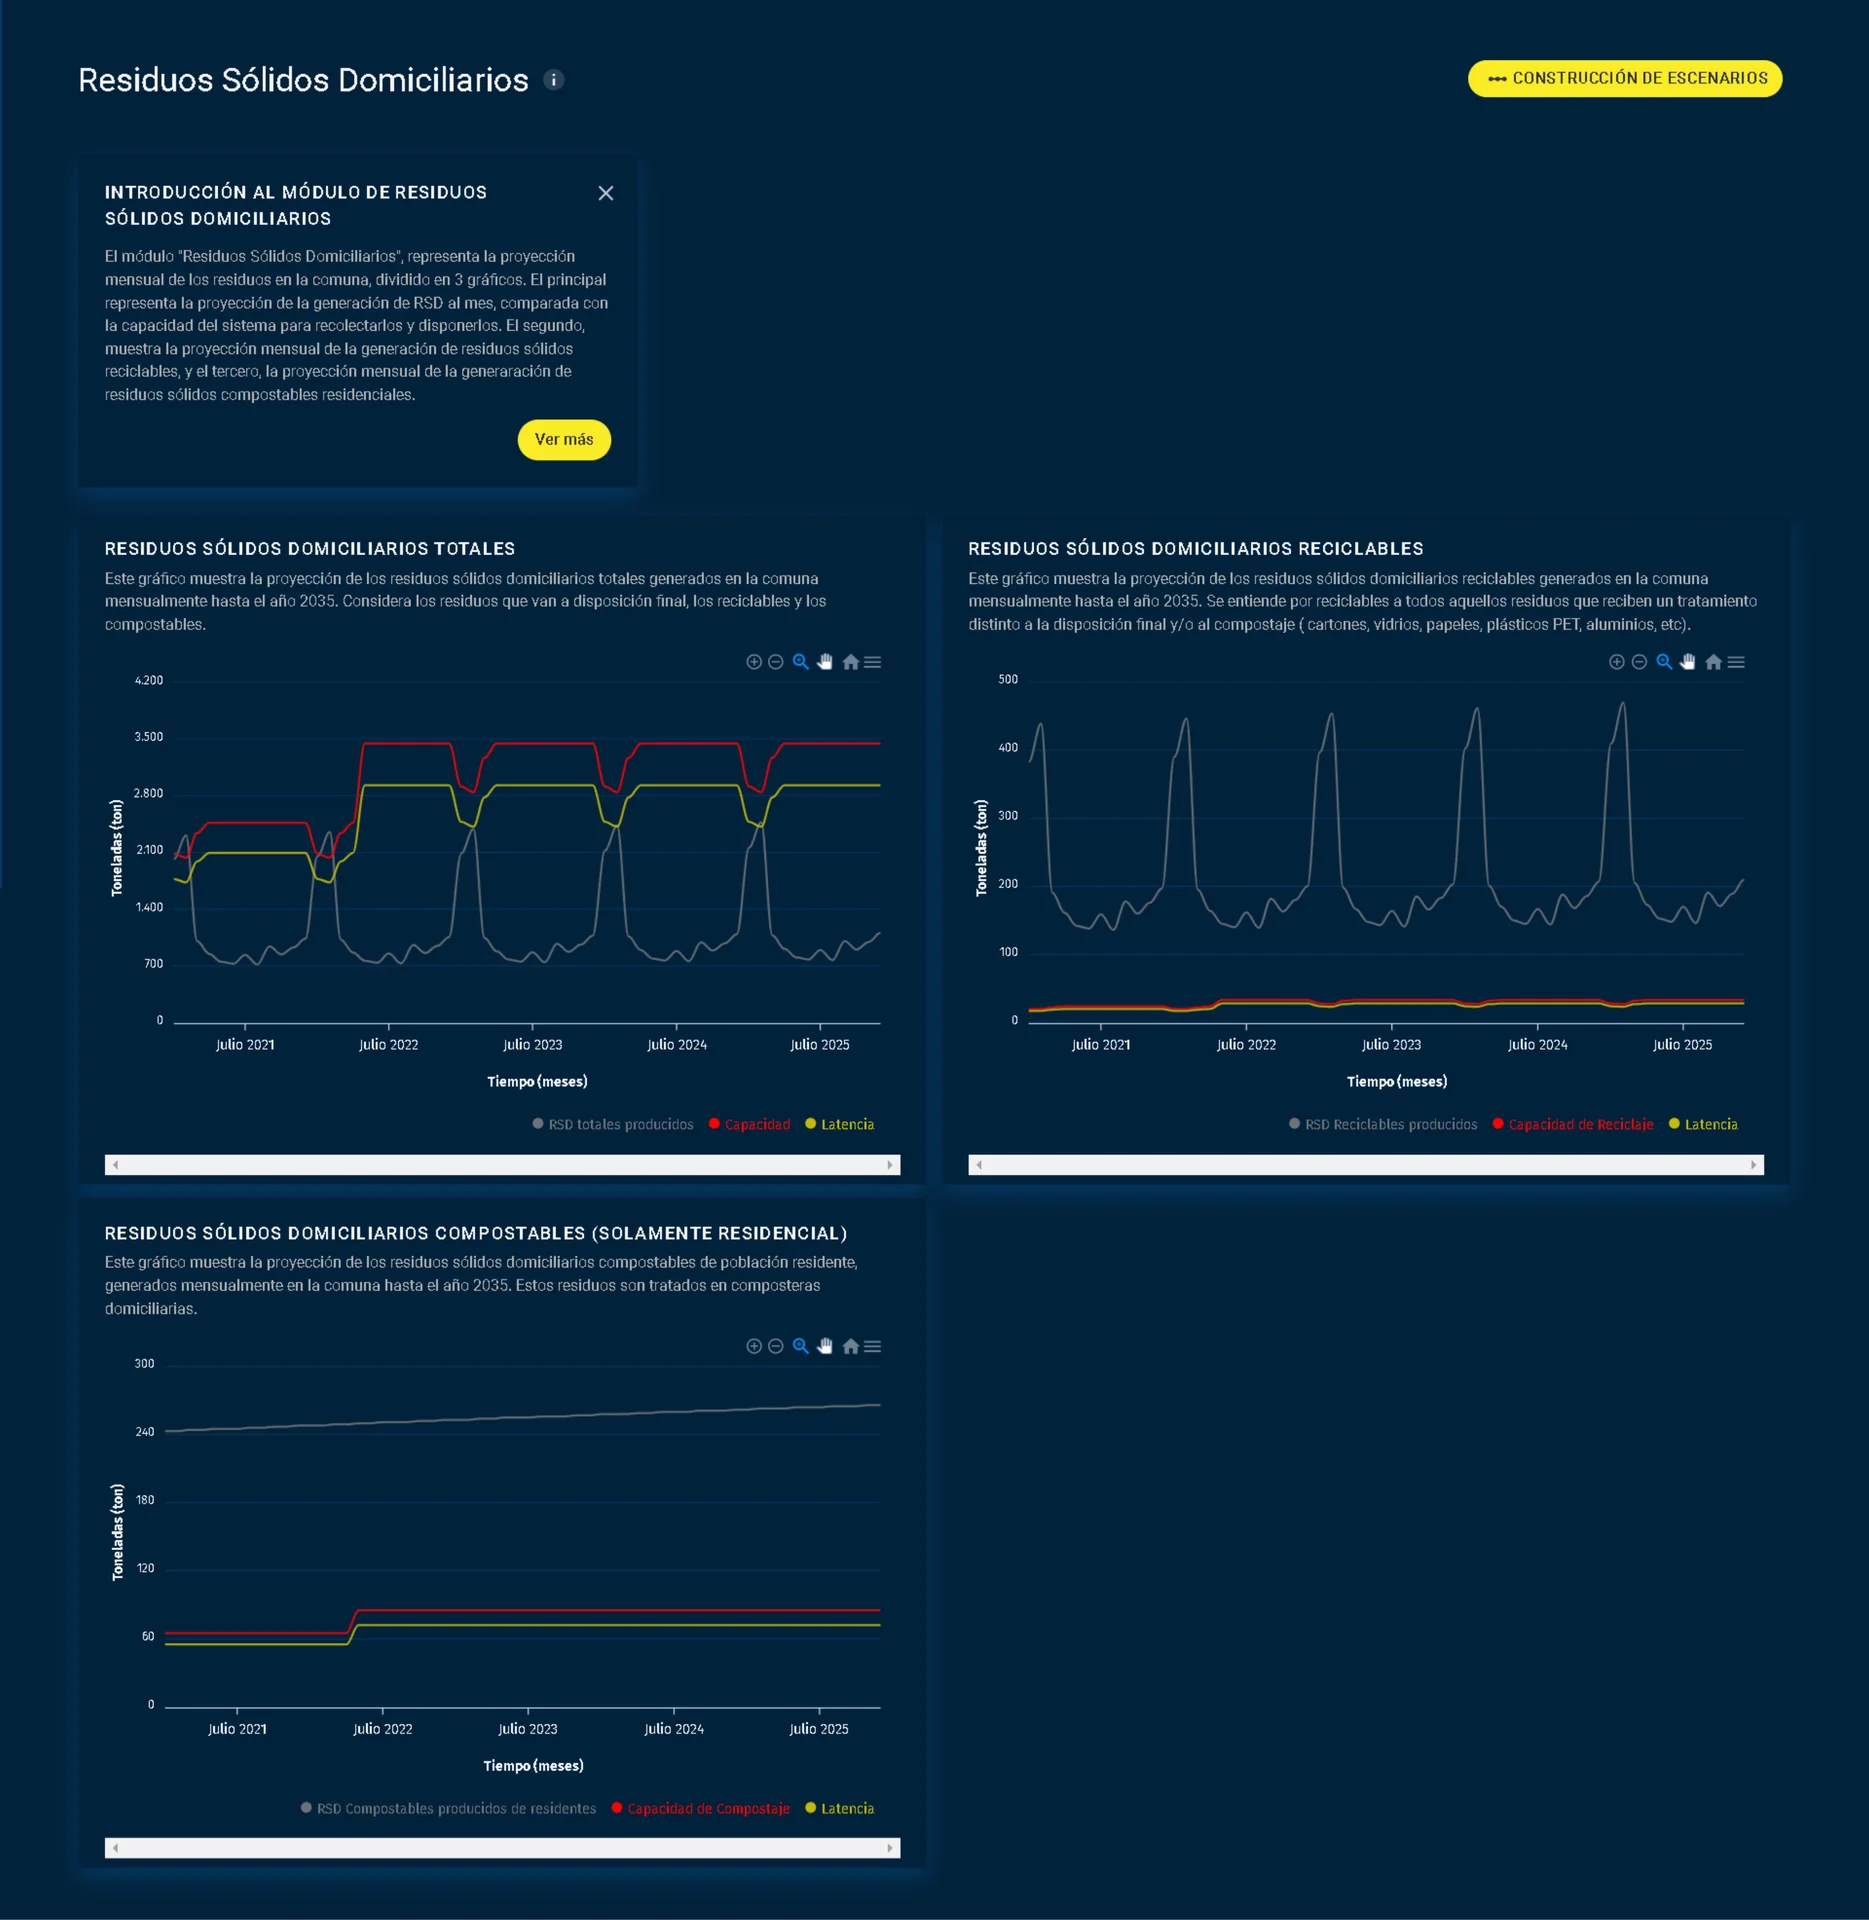
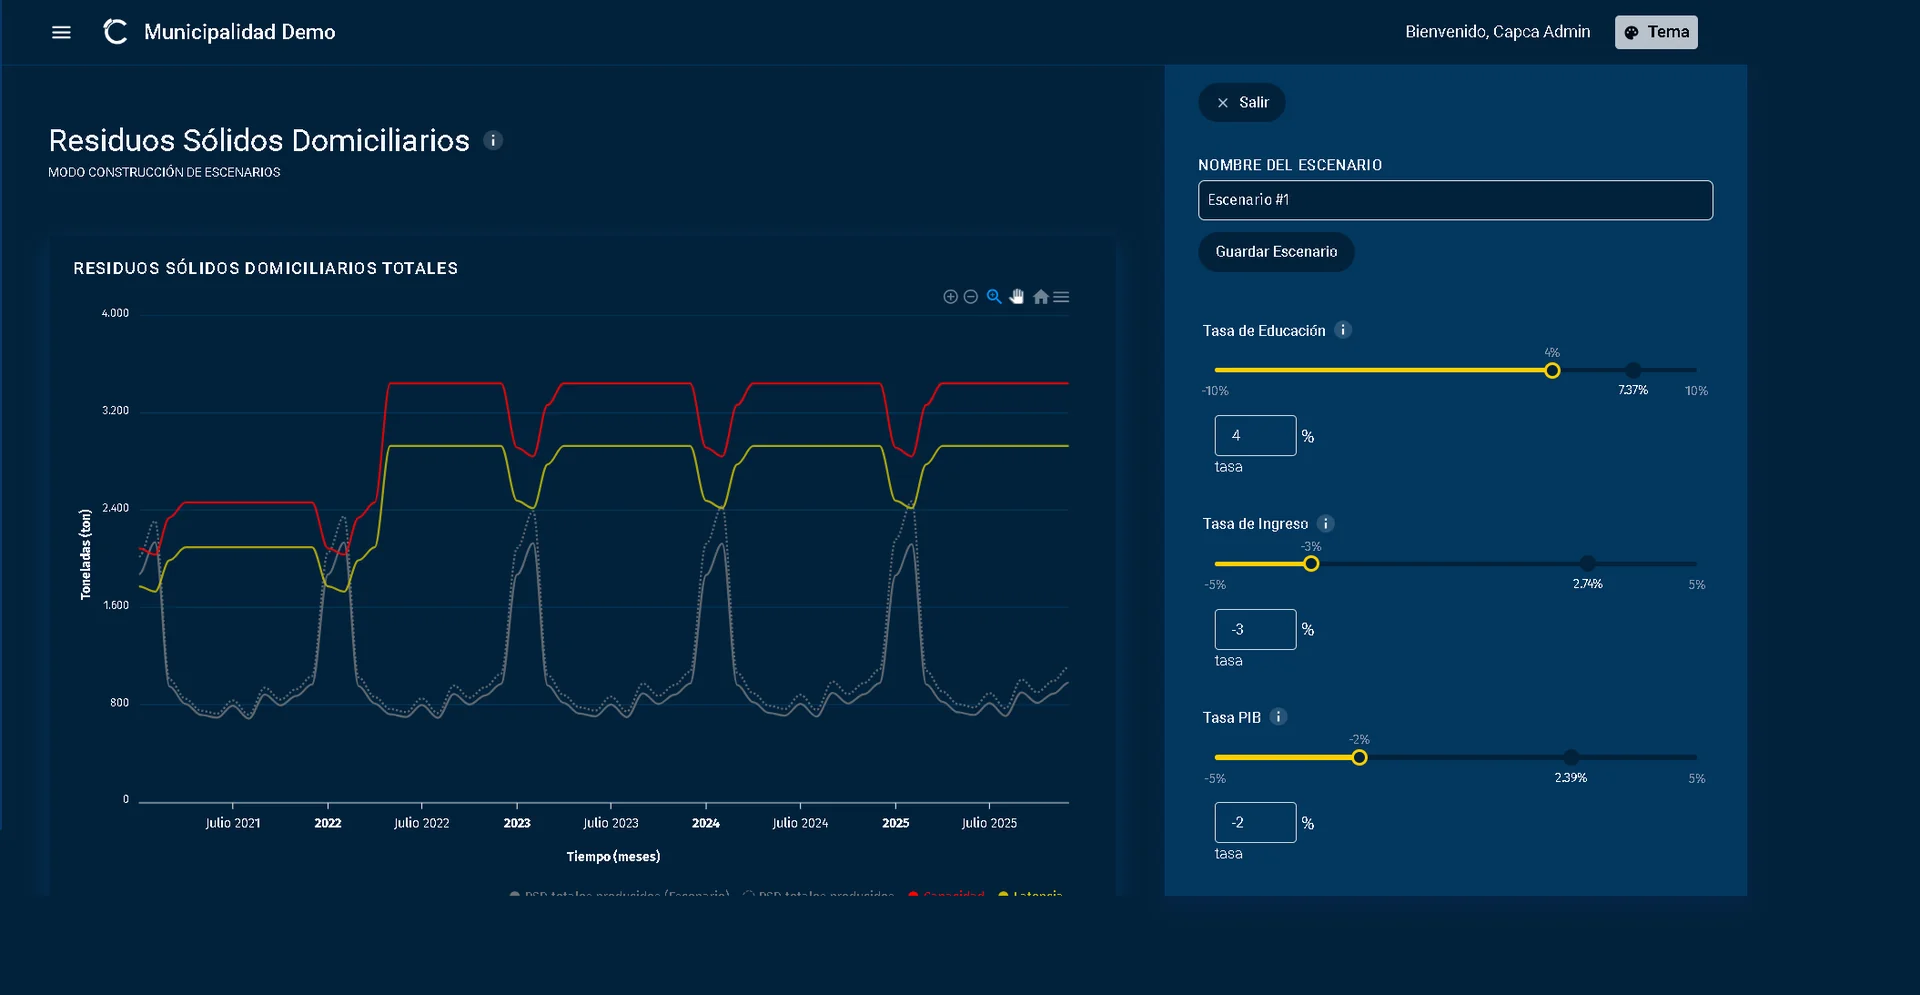
From a municipal user's perspective, CAPCA is a dashboard of ten core services — population, health, household waste, education, security, electricity, potable water, housing, motorization, formal tourism. Each service shows a traffic-light indicator against a latency band (the lead time a municipality actually needs to react — roughly two years, for example, to procure a new waste-collection truck) and a capacity ceiling. Behind each tile sits a research-grade projection model that forecasts five years ahead on the municipality's own historical data. A scenario builder lets planners drag three macroeconomic parameters — education rate, income rate, GDP — and watch the projected curves shift live; scenarios can be saved and exported as PDFs.
At the system level, CAPCA was built by a multidisciplinary team of eleven — frontend, backend, data science, data engineering, product, design — shipping a government-grade platform out of an academic research effort. The constraints stacked: simple enough for municipal staff with limited software background, robust enough to run reliably in production, and flexible enough to model communes as different as Rapa Nui (Easter Island), El Quisco, Pirque, and Renca — coastal, rural, dense, remote. And the system had to scale from the first pilot to the 11+ communes it runs in today, each with its own data ingestion and approval workflow.
My Role
Technical Lead · Principal Backend Engineer · Architect.
Hired to lead the backend, I ended up owning the full technical architecture of the platform — how the parts of the system fit together, how it ran in production, and how a multidisciplinary team of eleven shipped a government-grade tool together. The team brought deep expertise across disciplines: a senior frontend engineer, backend specialists, and a data-science core (including a PhD data engineer and a research analyst). My role was to shape the architecture that let all of that expertise land on a single operational platform.
Day-to-day, the work mixed three layers: hands-on backend development (the core API surface, the role-based permissions model, the data-upload and approval flows, the async job pipeline), architectural decisions across the frontend, backend, and data layers, and the engineering-practice work needed to move a university research project onto cloud infrastructure — containers, CI/CD, staging, monitoring. Toward the end of the engagement, a dedicated infrastructure engineer was brought in to take ownership of ongoing operations.
Key moments.
01
Designing for a municipal hierarchy
Chilean municipal work is strongly hierarchical — decisions flow through department heads, approvals happen at multiple levels, and nothing enters an official record without being signed off. That shape is baked into the platform: every commune has an administrator, every administrator invites department heads, every head has staff users, and every user has a role that controls what they can see and edit. Data uploaded by a junior user flows to their supervisor for review and approval before it ever enters the forecasting model. The hierarchy is not a bolt-on — it is the shape of the data model.
02
A UI for users who don't use spreadsheets
The primary users are municipal staff, not software users. Some had never opened a spreadsheet. That reshaped every UX decision: the dashboard is stripped down to traffic-light tiles with one number each; an in-app data-entry mode sits next to the spreadsheet upload so a user can type values into a grid without ever touching Excel; approval and feedback happen inside the app, with plain-language messages.
03
Bringing a research model into production
The forecasting engine at the heart of CAPCA is a research computation model that projects five years ahead from historical monthly data. It was written, naturally, in a tool better suited to research than to production services. Rather than rewrite it — which would have thrown away years of the research team's work — we wrapped it behind a clean service interface so the rest of the platform could call it like any other backend, and kept the research code where it belonged.
04
Establishing engineering practice on a university project
A research team at a top university still runs, typically, on research tooling — local scripts, manual deploys, small test datasets. CAPCA needed to run as a government tool, for real municipalities, reliably. That meant introducing containers, CI/CD, cloud infrastructure, and an agile delivery cadence incrementally across the engagement — not as a mandate, but as practices adopted because they made shipped work easier. Late in the project, a dedicated infrastructure engineer was hired to take over ongoing operations.
The outcome.
- In production in 11+ Chilean municipalities as of 2026 — five years after the first delivery. The system is still maintained and growing.
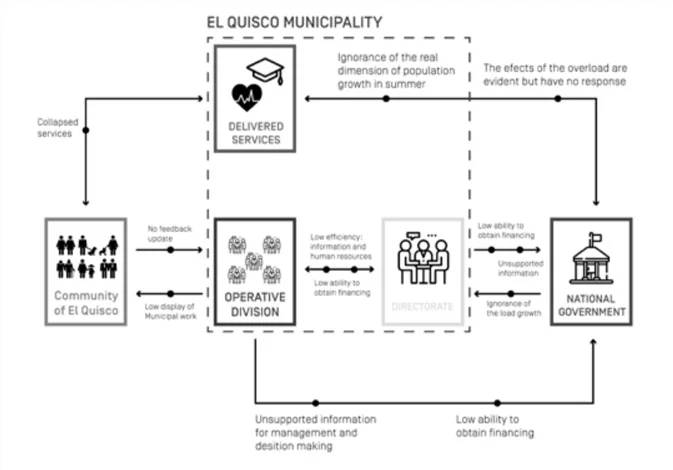
- Pilots spanned Chile's geographic extremes: Easter Island (Rapa Nui) — the original demographic-load study behind Chile's Law 21.070 on residency — plus El Quisco (coastal, summer surge), Pirque (rural metropolitan fringe), and Renca (dense Santiago commune).
- 10 core municipal services modeled per commune, each with a 5-year projection and a scenario builder on top.
- Recognition trajectory: FONDEF-IT funding (ANID, 2019) → Avonni 2023 finalist → ANID Startup Ciencia 2025 winner, with incorporation into the HUBTEC and Cero Labs UC tech-transfer portfolios.
- Academic and business-press coverage including El Mercurio, Diario Sustentable, Diario Estrategia, Portal Innova, and UC's institutional channels (see press below).
In the press.
CAPCA has been covered in Chilean business and innovation press since its early pilots, and tracked in UC's own institutional channels across its award trajectory — from the 2023 municipal launches through the ANID Startup Ciencia 2025 win.
Articles
FADEU · UC
Proyecto CAPCA gana Startup Ciencia 2025 de ANID
April 2025
Instituto de Estudios Urbanos UC
"Innovación tecnológica para la gestión inteligente de ciudades": Roberto Moris en Smartcity Expo Santiago
July 2024
Cero Labs UC
CAPCA — Gestión predictiva municipal
2024
Transferencia y Desarrollo UC
Junto a alcaldes y autoridades se realizó lanzamiento de CAPCA, software para la gestión territorial creado en la UC
April 2023
Portal Innova
Exitoso lanzamiento CAPCA, innovador software predictivo de Capacidad de Carga Demográfica
April 2023
Diario Sustentable
CAPCA, el innovador software predictivo para la gestión de los territorios
February 2023
Diario Estrategia
CAPCA, el innovador software predictivo para la gestión de los territorios
January 2023
Instituto de Estudios Urbanos UC
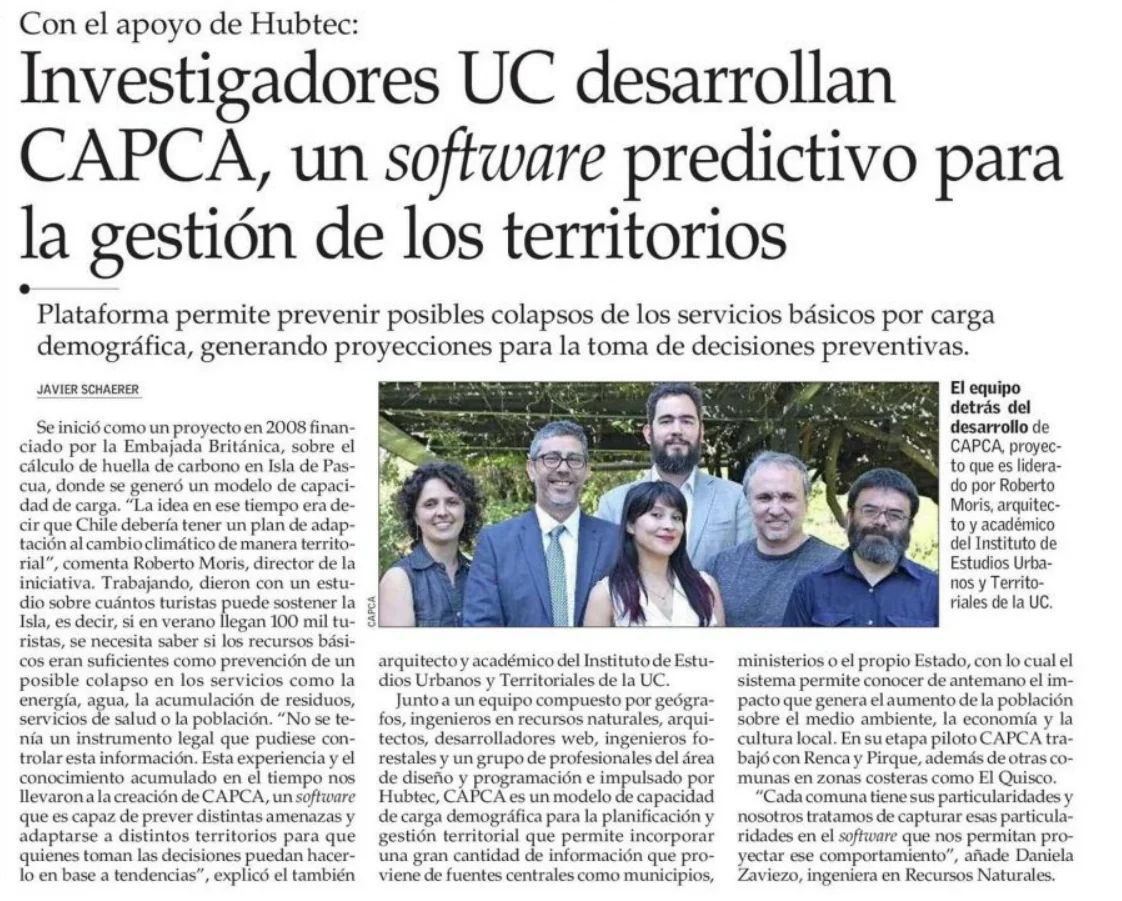
El Mercurio: Investigadores UC desarrollan CAPCA, un software predictivo para la gestión de los territorios
2023
Building software with a research team or a public-sector partner?
I work with groups that need someone who can own the architecture, write the backend, and set up production engineering — on projects where the goal is a live system, not a paper.
Let's talkMore work.
GovTech / Smart City · 2023–2024
CEGIR
A ~$2M smart-city program for Santiago's Metropolitan Region.
AI / SaaS · 2025
CandidatePilot
Multi-agent AI that evaluates 400 CVs so hiring teams can focus on the top 5.
AI / SaaS · 2026
AskMyCourse
A production RAG system that runs at under $1/month with verified citations.